. 2019 Jul 15;10(1):3100.
doi: 10.1038/s41467-019-10837-2.

Environmental conditions shape the nature of a minimal bacterial genome

Affiliations

Environmental conditions shape the nature of a minimal bacterial genome

Magdalena Antczak et al. Nat Commun. .

Abstract

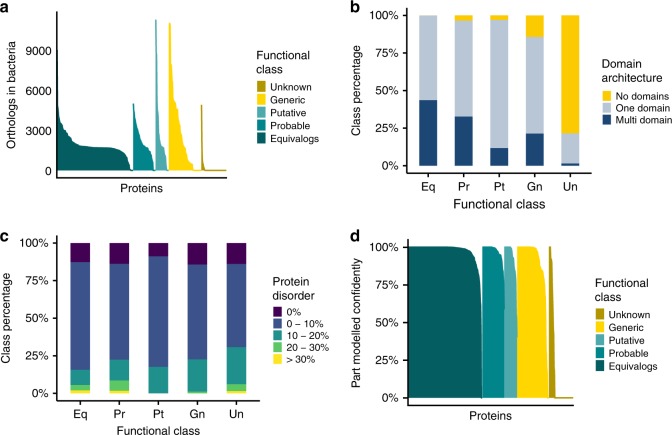
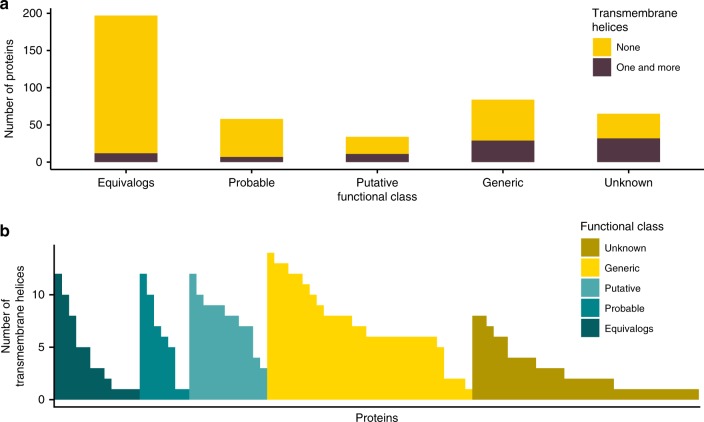
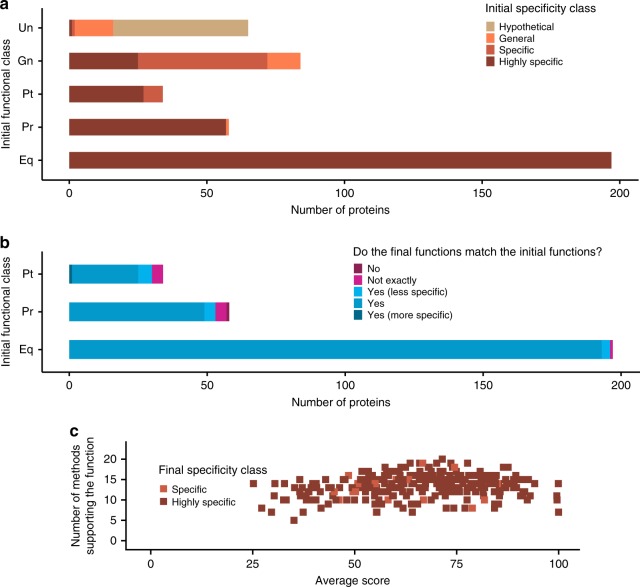
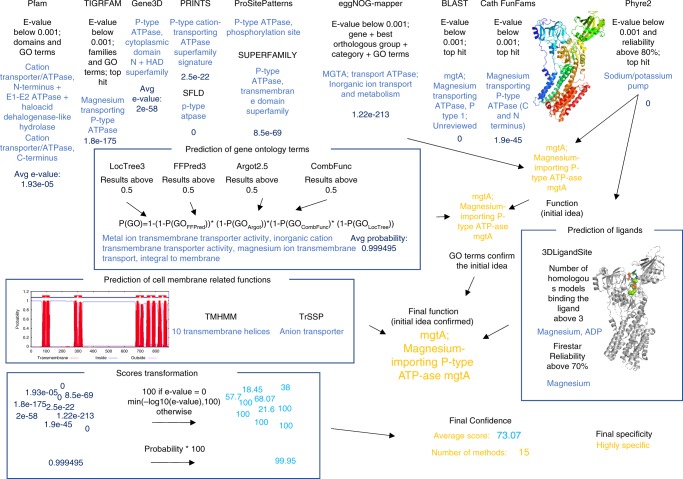
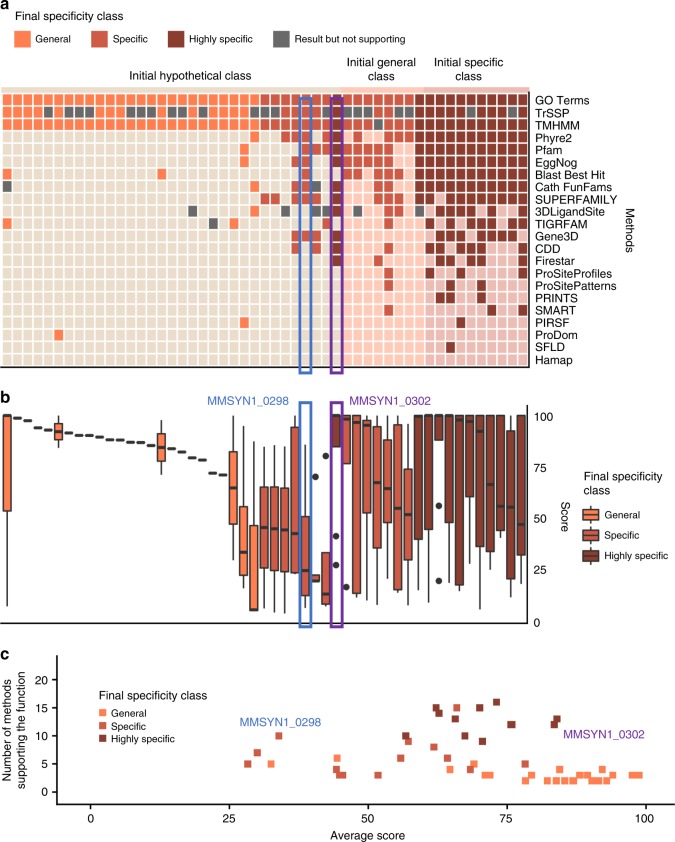
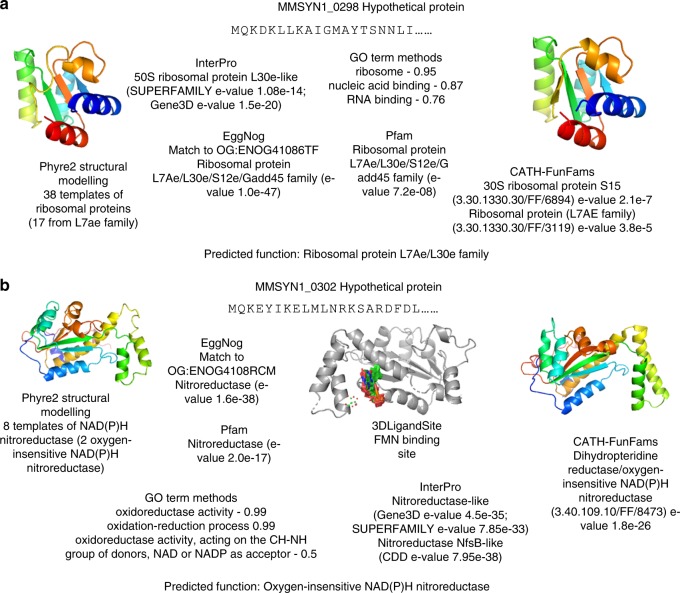
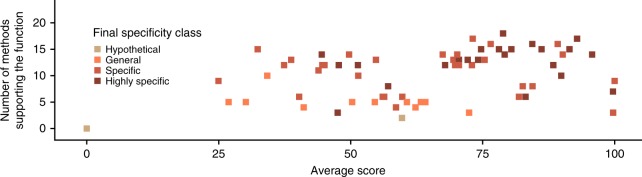
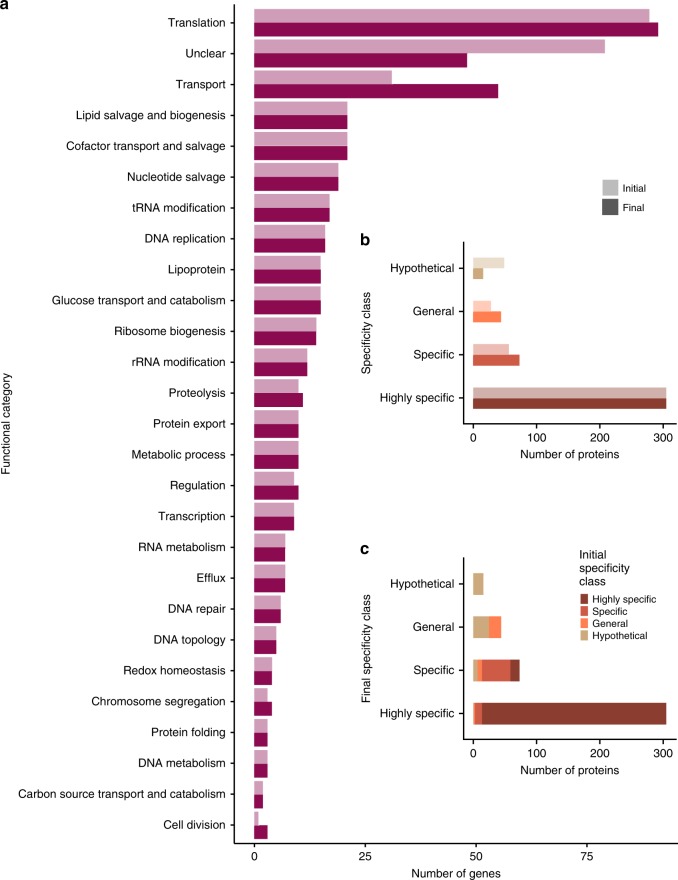
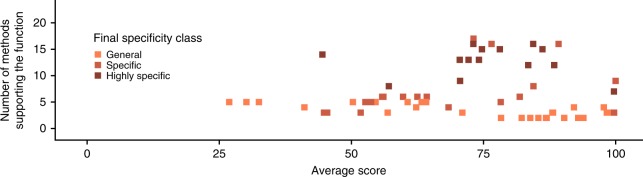
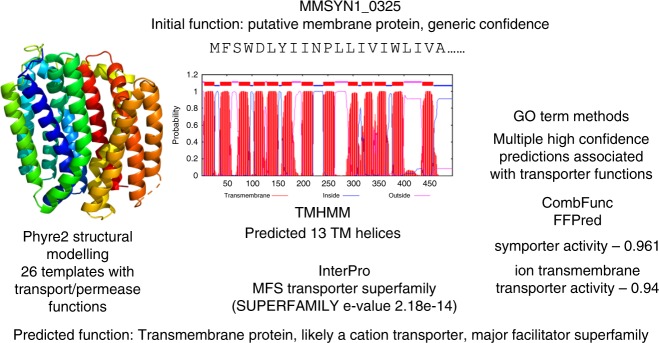
Of the 473 genes in the genome of the bacterium with the smallest genome generated to date, 149 genes have unknown function, emphasising a universal problem; less than 1% of proteins have experimentally determined annotations. Here, we combine the results from state-of-the-art in silico methods for functional annotation and assign functions to 66 of the 149 proteins. Proteins that are still not annotated lack orthologues, lack protein domains, and/ or are membrane proteins. Twenty-four likely transporter proteins are identified indicating the importance of nutrient uptake into and waste disposal out of the minimal bacterial cell in a nutrient-rich environment after removal of metabolic enzymes. Hence, the environment shapes the nature of a minimal genome. Our findings also show that the combination of multiple different state-of-the-art in silico methods for annotating proteins is able to predict functions, even for difficult to characterise proteins and identify crucial gaps for further development.


Conflict of interest statement

The authors declare no competing interests.

Figures

Fig. 1
Fig. 1
Basic characterisation of proteins encoded by the minimal bacterial genome. a Orthologues identified in bacteria. Results for each functional class are represented by a different colour: gold for the Unknown class, yellow–Generic, light turquoise–Putative, turquoise–Probable and dark turquoise–Equivalog. b The domain architecture for proteins in each of the five functional confidence classes is plotted (Unknown [Un], Generic [Gn], Putative [Pt], Probable [Pr] and Equivalog [Eq]). Proteins with no domains are displayed in yellow, grey represents single domain proteins and dark blue multi-domain proteins. c Predicted protein disorder in the minimal genome proteins. The results are shown for the five confidence classes from b and coloured according to the percentage of disorder present. Proteins with a percentage disorder >30% are represented by yellow, 20–30% disorder by green, 10–20%-turquoise and 0–10%-blue. Purple indicates proteins without disordered regions. d The percentage of protein structure that can be confidently modified by Phyre2. Functional class colouring as for a
Fig. 2
Fig. 2
Transmembrane proteins encoded by the minimal bacterial genome. a The number of proteins predicted by TMHMM to have transmembrane helices. Brown indicates proteins with one or more transmembrane helix. Yellow for those without transmembrane helices. b The number of transmembrane helices present in each of the proteins in the minimal genome that is predicted to have one or more transmembrane helix. Results for each functional class are represented by a different colour: gold for the Unknown class, yellow–Generic, light turquoise–Putative, turquoise–Probable and dark turquoise–Equivalog class
Fig. 3
Fig. 3
Predictions for proteins of known function encoded by the minimal genome. a Assessment of the specificity of functions predicted by Hutchison et al. across all five initial functional classes (Unknown to Equivalog). Functions from different initial specificity classes are represented by a different colour: beige for the Hypothetical specificity class, orange–General, light brown–Specific and dark brown–Highly specific. b Comparison of our predictions with the functions predicted by Hutchison et al. for proteins of known function, i.e., from the Putative, Probable and Equivalog functional classes. Colouring indicates the level of agreement between the initial functions and the predictions made here. Dark blue where the functions exactly match, medium blue where the predictions made here were less specific than the initial ones, light blue where our predictions were more specific, dark purple where there were minor differences between the functions and light purple where the function did not agree. c Number of methods supporting the function and the average score of those methods. Each point represents a protein. Methods include those used in the first step of function prediction. Specificity class colouring as for a
Fig. 4
Fig. 4
Assigning function to proteins in the minimal genome. The flowchart outlines how functions were assigned to the proteins using MMSYN1_0879 as an example. The top row of methods are used to identify a likely function. The methods in the three groups of boxes (predicted GO terms, ligand binding predictions and membrane protein predictions) are then used to see if they support the function identified by the first group. Where the first group does not predict a function then this second group was used. The figure shows the results obtained for MMSYN1_0879, which was annotated as the gene mgtA, a magnesium importing P-type ATPase
Fig. 5
Fig. 5
Proteins assigned new functions. This figure shows the 51 proteins where the specificity class was increased. Results for each final specificity class are represented by a different colour: orange for the General specificity class, light brown–Specific and dark brown–Highly specific. a Each column represents a protein in the minimal genome and the squares show the methods that made predictions (darker colours indicate support of the final prediction), grey squares indicate predictions that did not support the function, light squares indicate that a method did not make a prediction. Proteins are grouped by their initial specificity class (Hypothetical, General, Specific and Highly specific) and then by their final specificity class. b Boxplot demonstrating the distribution of the scores across proteins. Proteins grouped by their initial specificity class and then by their final specificity class. Horizontal lines represent the median, the lower and upper hinge show respectively first quartile and third quartile, and lower and upper whisker include scores from first quartile to (distance between the first and third quartile) × 1.5 (for lower whisker) and from third quartile to (distance between the first and third quartile) × 1.5 (for upper whisker). Any scores outside of these intervals are shown as points. c The number of methods supporting the function and the average score. Each point represents a protein
Fig. 6
Fig. 6
Confident predictions of protein function in the minimal genome. Both a MMSYN1_0298 and b MMSYN1_0302 were previously classified as hypothetical proteins. The results from prediction methods and the function assigned are shown
Fig. 7
Fig. 7
Multiple methods supporting existing annotations. For all proteins where the predicted function agreed with the existing annotation (i.e., the specificity class was not changed), the number of methods that predicted the function is plotted against the average score from these methods. Points for each of the final specificity classes are represented by a different colour: beige for the Hypothetical specificity class, orange–General, light brown–Specific and dark brown–Highly specific
Fig. 8
Fig. 8
Functional annotations of the minimal bacterial genome. The number of proteins in each of the a protein biological process categories (light and dark purple indicate initial and final categories, respectively). b Specificity classes is shown with the original minimal genome annotation and the annotations identified here. c Shows the change in specificity classes, coloured based on the original specificity class. Results for each initial specificity class are represented by a different colour: beige for the Hypothetical specificity class, orange–General, light brown–Specific and dark brown–Highly specific
Fig. 9
Fig. 9
Prediction of membrane related functions. Each point represents a protein with initially unknown function for which we assigned cell membrane related functions (e.g., transmembrane, transporter). The number of methods that supported the prediction is plotted against the average score from these methods. Points for each of the final specificity classes are represented by a different colour: orange for the General specificity class, light brown–Specific and dark brown–Highly specific
Fig. 10
Fig. 10
MMSYN1_0325 is predicted to be a transporter and member of the Major facilitator Superfamily. The results from Phyre2, TMHMM, the combination of GO term prediction methods (numbers shown are probability associated with each function) and InterPro are shown. All of these methods supported a transporter function with Phyre2 and InterPro confidently identifying association with the Major facilitator superfamily

References

    1. Hutchison CA, et al. Design and synthesis of a minimal bacterial genome. Science. 2016;351:aad6253. doi: 10.1126/science.aad6253. - DOI - PubMed
    1. Haft DH, et al. TIGRFAMs and genome properties in 2013. Nucl. Acids Res. 2013;41:D387–D395. doi: 10.1093/nar/gks1234. - DOI - PMC - PubMed
    1. Chang Y-C, et al. COMBREX-DB: an experiment centered database of protein function: knowledge, predictions and knowledge gaps. Nucl. Acids Res. 2016;44:D330–D335. doi: 10.1093/nar/gkv1324. - DOI - PMC - PubMed
    1. Price MN, et al. Mutant phenotypes for thousands of bacterial genes of unknown function. Nature. 2018;557:503–509. doi: 10.1038/s41586-018-0124-0. - DOI - PubMed
    1. The UniProt Consortium. UniProt: the universal protein knowledgebase. Nucl. Acids Res. 2017;45:D158–D169. doi: 10.1093/nar/gkw1099. - DOI - PMC - PubMed

MeSH terms