. 2019 Aug;38(33):6109-6122.
doi: 10.1038/s41388-019-0868-5. Epub 2019 Jul 15.

Gene expression profiles of CMS2-epithelial/canonical colorectal cancers are largely driven by DNA copy number gains

Affiliations

Gene expression profiles of CMS2-epithelial/canonical colorectal cancers are largely driven by DNA copy number gains

Kaja C G Berg et al. Oncogene. 2019 Aug.

Abstract

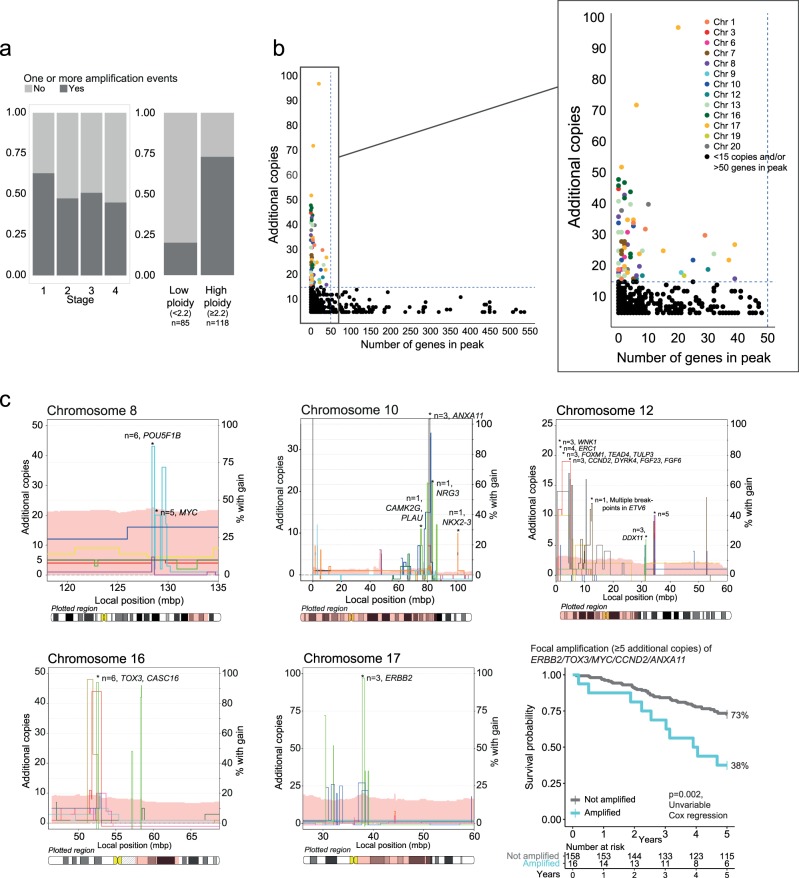
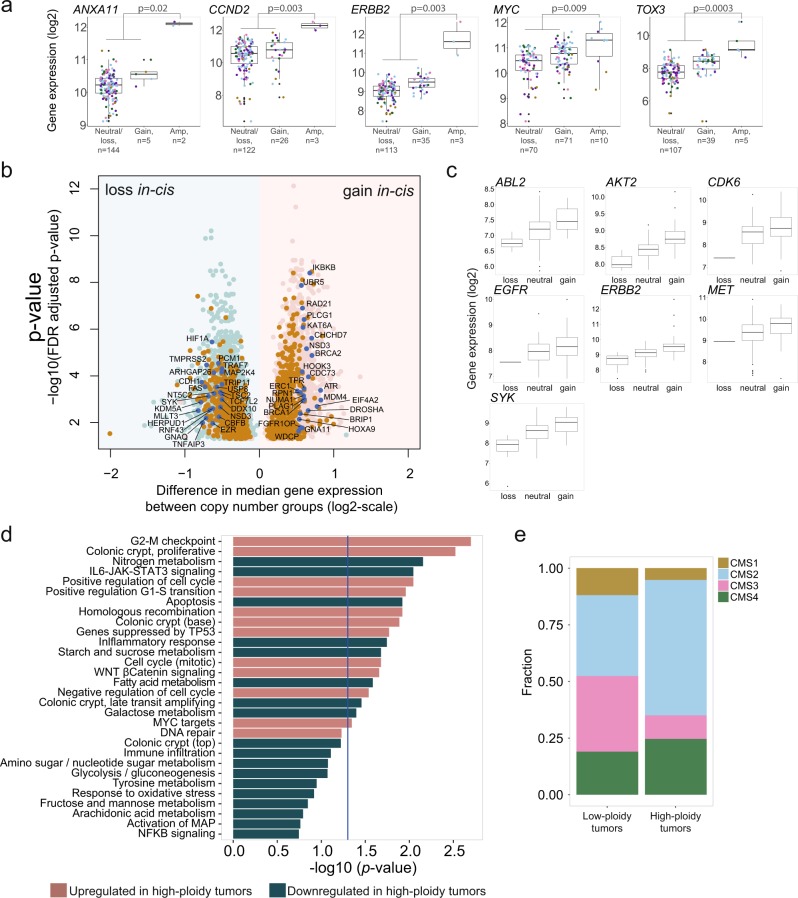
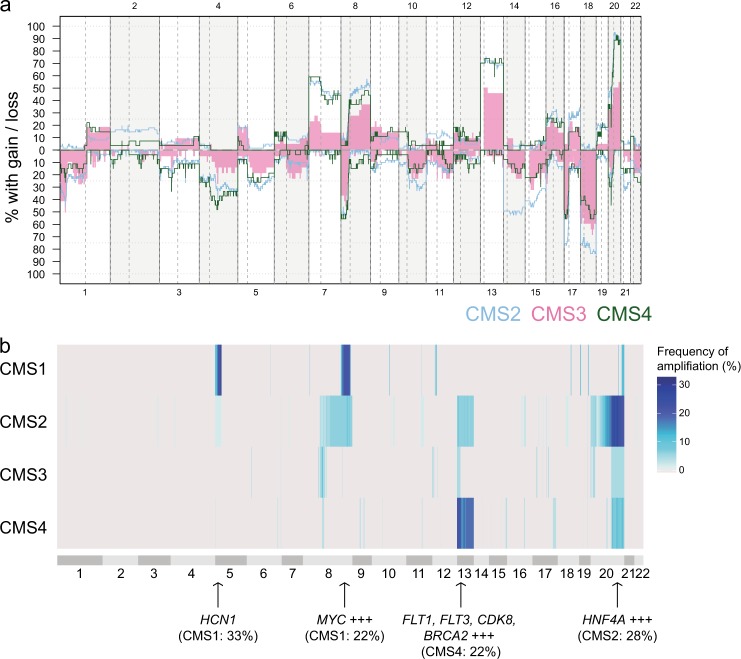
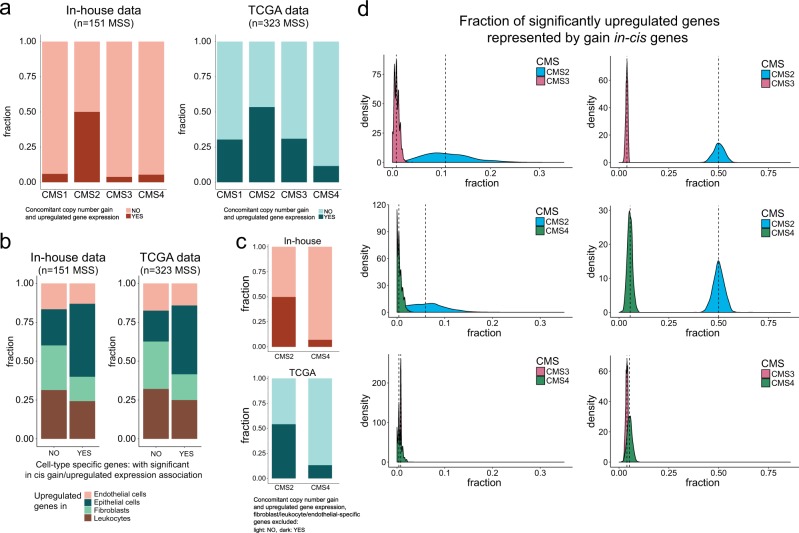
About 80% of colorectal cancers (CRCs) have chromosomal instability, which is an integral part of aggressive malignancy development, but the importance of specific copy number aberrations (CNAs) in modulating gene expression, particularly within the framework of clinically relevant molecular subtypes, remains mostly elusive. We performed DNA copy number profiling of 257 stage I-IV primary CRCs and integrative gene expression analysis in 151 microsatellite stable (MSS) tumors, focusing on high-level amplifications and the effect of CNAs on the characteristics of the gene expression-based consensus molecular subtypes (CMS). The results were validated in 323 MSS tumors from TCGA. Novel recurrent high-level amplifications (≥15 additional copies) with a major impact on gene expression were found for TOX3 (16q) at 1.5% frequency, as well as for CCND2 (12p) and ANXA11 (10q) at 1% frequency, in addition to the well-known targets ERBB2 (17q) and MYC (8q). Focal amplifications with ≥15 or ≥5 additional copies of at least one of these regions were associated with a poor overall survival among patients with stage I-III MSS CRCs (multivariable hazard ratio ≥3.2, p ≤ 0.01). All high-level amplifications were focal and had a more consistent relationship with gene expression than lower amplitude and/or broad-range amplifications, suggesting specific targeting during carcinogenesis. Genome-wide, copy number driven gene expression was enriched for pathways characteristic of the CMS2-epithelial/canonical subtype, including DNA repair and cell cycle progression. Furthermore, 50% of upregulated genes in CMS2-epithelial/canonical MSS CRCs were driven by CNAs, an enrichment compared with the other CMS groups, and associated with the stronger correspondence between CNAs and gene expression in malignant epithelial cells than in the cells of the tumor microenvironment (fibroblasts, endothelial cells, leukocytes). In conclusion, we identify novel recurrent amplifications with impact on gene expression in CRC and provide the first evidence that CMS2 may have a stronger copy-number related genetic basis than subtypes more heavily influenced by gene expression signals from the tumor microenvironment.


Conflict of interest statement

The authors declare that they have no conflict of interest.

Figures

Fig. 1
Fig. 1
Recurrent high-level amplifications in CRC (a) The fraction of tumors with at least one amplification event was not associated with stage, but was substantially higher in high-ploidy tumors compared to low-ploidy tumors. b We identified a clear separation between focal and broad amplifications at approximately 15 additional copies and 50 genes in peak. Focal amplifications were distributed across multiple chromosomes (zoomed). c On five of the chromosomes with recurrent focal high-level amplifications (≥15 additional copies, <50 genes in peak), additional tumors had focal amplifications with ≥5 additional copies. Including all these amplicons, the amplification frequency was 1.5% (three tumors) for ANXA11 (10q), CCND2 (12p) and ERBB2 (17q); 2.5% (five tumors) for MYC (8q); and 3% (six tumors) for TOX3 (16q). Combined survival analysis showed that the 16 stage I-III MSS patients displaying focal amplifications (with ≥5 additional copies) in either of the five genes demonstrated a significant association to poor patient outcome. Chromosome plots: Left y-axis: number of additional copies above median copy number (different colored lines represent different tumors). Right y-axis: the percentage of samples with gain in the region of interest, visualized as a light pink band behind the lines indicating individual tumors
Fig. 2
Fig. 2
DNA copy number aberrations with concomitant up- or downregulation of gene expression. a Gene expression was significantly higher in amplified compared to non-amplified groups in selected recurrently amplified genes. A threshold of 5 additional copies was used as threshold for amplification, and both broad and focal aberrations considered in the 151 tumors where CNA and gene expression data were available. Difference in gene expression was assessed by Wilcoxon rank-sum tests. Colored dots indicate CMS: yellow, CMS1; blue, CMS2; pink, CMS3; green, CMS4; purple, NA. b A total of 2467 genes (light pink) were significantly higher expressed in the copy number gain group compared to tumors with neutral copy number state, while 3080 genes (light blue) were significantly lower expressed upon copy number loss compared to tumors with neutral copy number state. All displayed genes were significant with FDR adjusted p < 0.05. Orange: genes that were significant in both gain and loss analyses and accordingly had a step-wise increase in gene expression from loss to neutral and gain; dark blue and labeled: cancer-critical genes. c Gene expression levels according to CNA status (loss, neutral, gain) for seven oncogenic protein kinases with a significant upregulation of gene expression associated to copy number gain. d The high-ploidy group was characterized by downregulation of pathways related to metabolism and immune activation and upregulation of gene signatures related to WNT signaling, cell cycle, homologous recombination, and proliferative colon signature. e The high-ploidy group was enriched for CMS2 tumors, shown as the fraction of tumors belonging to each CMS subtype in the low-ploidy and high-ploidy groups. Only CMS classified tumors are shown (n = 42 low-ploidy tumors; n = 77 high-ploidy tumors)
Fig. 3
Fig. 3
Copy number aberrations relate to CMS (a) Frequency of copy number gain and loss in 119 CMS classified MSS tumors, shown according to CMS subtype. CMS1 MSS were excluded from the plot due to low sample size (n = 9), gains and losses in CMS1 MSS were included as a separate plot in Supplementary Fig. 1e. Blue: CMS2, pink: CMS3, green: CMS4. b The four CMSs differed in the frequencies of amplifications (≥5 additional copies) across the genome (n = 119 MSS tumors). The length of the chromosome bands reflects the number of DNA segments and does not directly represent genomic positions. The figure includes data from CMS1 n = 9, CMS2 n = 61, CMS3 n = 22, CMS4 n = 27
Fig. 4
Fig. 4
CMS2-associated gene expression profiles are associated to copy number gain. a Compared to other subtypes, CMS2 tumors had a substantially larger fraction of significant upregulated genes (limma analysis) that were also associated with copy number gain (in an in cis manner), both in the inhouse cohort and in TCGA data. b Analyses of both inhouse and TCGA data revealed that epithelial-specific genes were enriched among genes with significant association between in cis gain and upregulated gene expression, compared to genes preferentially expressed in endothelial cells/leukocytes/fibroblasts. c When depleting the list of preferentially expressed genes of fibroblast/endothelial/leukocyte-specific genes, the proportion of genes with significant in cis gain/upregulation remained around 50% in CMS2 and below 15% for CMS4 in both the inhouse and the TCGA cohorts. d Left panel: We performed random sampling (n = 1000 iterations) of 20 tumors from each subtype with subsequent pairwise calculation of the fraction of CMS-specific upregulated genes consisting of genes in the gain/upregulation category (CMS2 versus CMS3, CMS2 versus CMS4 and CMS3 versus CMS4; CMS1 was excluded due to the low sample number). Specifically, we randomly sampled 250 differentially upregulated genes from the original results on differential gene expression (performed on all CMS classified tumors) and calculated significant gain/upregulated genes separately for each iteration on the 40 sampled tumors. The figure shows the density distribution of fractions calculated for the 1000 iterations. Comparing CMS2 and CMS3, CMS2 had the largest fraction of differentially upregulated genes represented by gain/upregulated genes in all 1000 iterations. Comparing CMS2 and CMS4, CMS2 had the largest fraction of upregulated genes represented by gain in cis genes in 99.4% of the iterations. CMS3 and CMS4 were more similar, with CMS3 having a higher fraction in 64% of the iterations. Right panel: Random repeated sampling of 250 differentially upregulated genes and 250 gain in cis genes (n = 1000 iterations) from the original analyses corroborated that CMS2 had a substantially higher fraction of upregulated genes represented by in cis genes compared to other subtypes also when we controlled for the effect of different number of upregulated genes in each CMS group

Similar articles

Cited by

References

    1. Guinney J, Dienstmann R, Wang X, de Reyniès A, Schlicker A, Soneson C, et al. The consensus molecular subtypes of colorectal cancer. Nat Med. 2015;21:1350–6. doi: 10.1038/nm.3967. - DOI - PMC - PubMed
    1. Danielsen HE, Pradhan M, Novelli M. Revisiting tumour aneuploidy — the place of ploidy assessment in the molecular era. Nat Rev Clin Oncol. 2016;13:291. doi: 10.1038/nrclinonc.2015.208. - DOI - PubMed
    1. Lee AJX, Endesfelder D, Rowan AJ, Walther A, Birkbak NJ, Futreal PA, et al. Chromosomal instability confers intrinsic multidrug resistance. Cancer Res. 2011;71:1858–70. doi: 10.1158/0008-5472.CAN-10-3604. - DOI - PMC - PubMed
    1. Wang H, Liang L, Fang J-Y, Xu J. Somatic gene copy number alterations in colorectal cancer: new quest for cancer drivers and biomarkers. Oncogene. 2016;35:2011–9. doi: 10.1038/onc.2015.304. - DOI - PubMed
    1. Sartore-Bianchi A, Trusolino L, Martino C, Bencardino K, Lonardi S, Bergamo F, et al. Dual-targeted therapy with trastuzumab and lapatinib in treatment-refractory, KRAS codon 12/13 wild-type, HER2-positive metastatic colorectal cancer (HERACLES): a proof-of-concept, multicentre, open-label, phase 2 trial. Lancet Oncol. 2016;17:738–46. doi: 10.1016/S1470-2045(16)00150-9. - DOI - PubMed

Publication types

MeSH terms