. 2019 Aug;5(8):810-821.
doi: 10.1038/s41477-019-0452-6. Epub 2019 Jul 15.

Musa balbisiana genome reveals subgenome evolution and functional divergence

Affiliations

Musa balbisiana genome reveals subgenome evolution and functional divergence

Zhuo Wang et al. Nat Plants. 2019 Aug.

Abstract

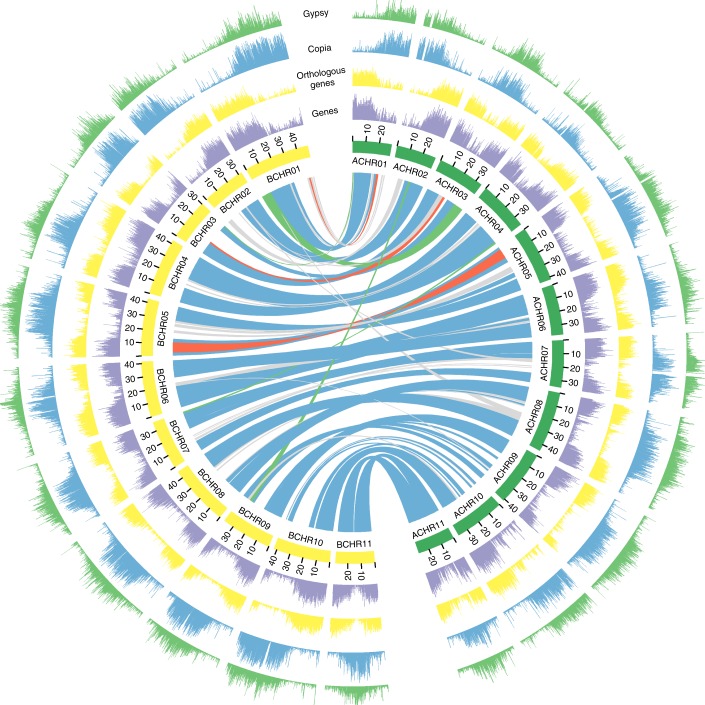
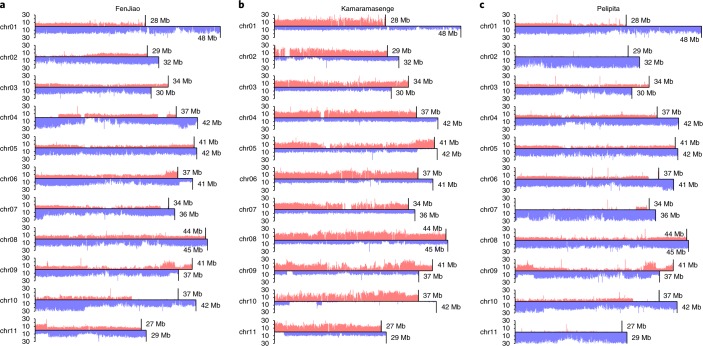
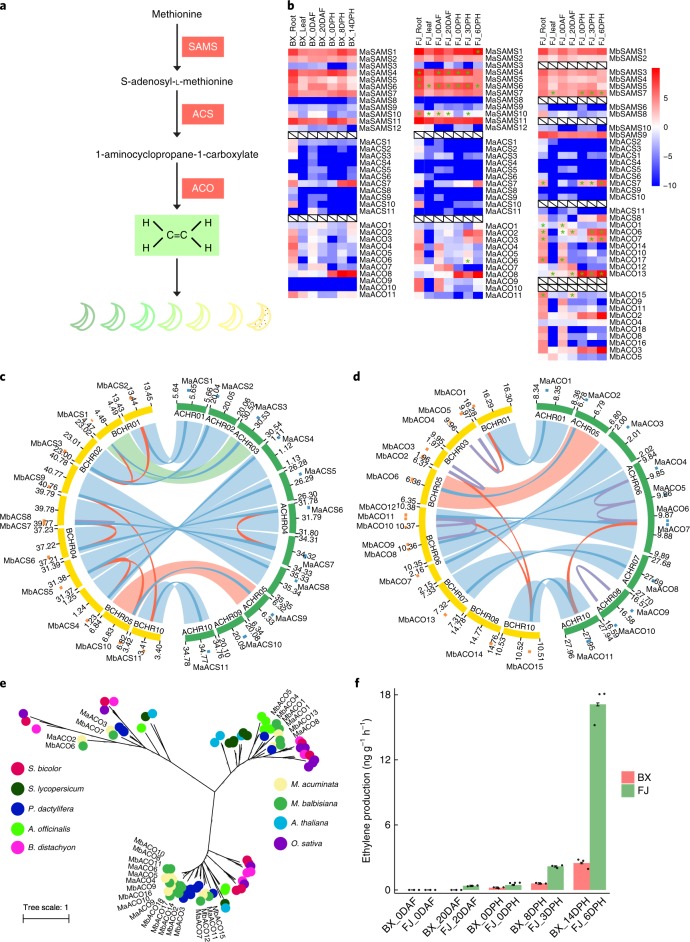
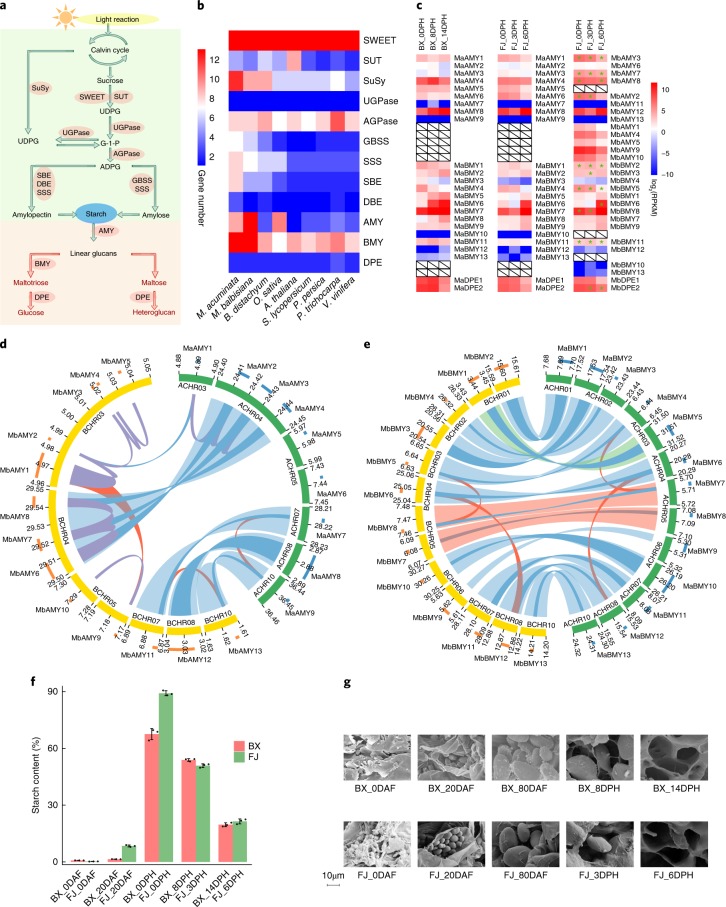
Banana cultivars (Musa ssp.) are diploid, triploid and tetraploid hybrids derived from Musa acuminata and Musa balbisiana. We presented a high-quality draft genome assembly of M. balbisiana with 430 Mb (87%) assembled into 11 chromosomes. We identified that the recent divergence of M. acuminata (A-genome) and M. balbisiana (B-genome) occurred after lineage-specific whole-genome duplication, and that the B-genome may be more sensitive to the fractionation process compared to the A-genome. Homoeologous exchanges occurred frequently between A- and B-subgenomes in allopolyploids. Genomic variation within progenitors resulted in functional divergence of subgenomes. Global homoeologue expression dominance occurred between subgenomes of the allotriploid. Gene families related to ethylene biosynthesis and starch metabolism exhibited significant expansion at the pathway level and wide homoeologue expression dominance in the B-subgenome of the allotriploid. The independent origin of 1-aminocyclopropane-1-carboxylic acid oxidase (ACO) homoeologue gene pairs and tandem duplication-driven expansion of ACO genes in the B-subgenome contributed to rapid and major ethylene production post-harvest in allotriploid banana fruits. The findings of this study provide greater context for understanding fruit biology, and aid the development of tools for breeding optimal banana cultivars.


Conflict of interest statement

The authors declare no competing interests.

Figures

Fig. 1
Fig. 1. Characterization of M. balbisiana (B-genome) and M. acuminata (A-genome) chromosomes.
Elements are arranged in the following scheme (from outer to inner). (1) Distribution of Gypsy elements (non-overlapping, window size, 50 kb); (2) distribution of Copia elements (non-overlapping, window size, 50 kb); (3) distribution of orthologous gene pairs between two genomes (non-overlapping, window size, 50 kb); (4) gene density (non-overlapping, window size, 50 kb); (5) syntenic relationships between A- and B-genomes. The connecting blue lines represent alignment blocks, red lines represent inversions, green lines represent translocations and grey lines show small blocks with<30 gene pairs.
Fig. 2
Fig. 2. Coverage depth and genome structure summary for three allotriploid banana accessions.
ac, Chromosome coverage and structure for accessions FenJiao (genome group, ABB) (a), Kamaramasenge (genome group, AAB) (b) and Pelipita (genome group, ABB) (c) with 100 kb non-overlapping sliding windows. The upper red bar and lower blue bar represent coverage depth of the A- and B-subgenome, respectively.
Fig. 3
Fig. 3. Phylogeny and expression patterns of ethylene biosynthesis genes between M. acuminata (A-genome) and M. balbisiana (B-genome).
a, Overview of the ethylene biosynthesis pathway. b, Expression patterns of SAMS, ACS and ACO family genes in the root and leaf, and at different stages of fruit development and ripening in BX, the A-subgenome of FJ and the B-subgenome of FJ. Genes aligned horizontally in the heat map indicate homoeologue gene pairs between the A- and B-genomes. White boxes with diagonals indicate the lack of homoeologue gene pairs between the A- and B-subgenomes. Asterisks indicate expression dominance of homoeologue gene pairs between the A- and B-subgenomes of FJ. c,d, Synteny analysis of ACS (c) and ACO (d) families between the A- and B-genomes. Red lines indicate paralogous gene pairs resulting from WGD, blue lines indicate homoeologous gene pairs, purple lines indicate tandem duplication, light blue strips indicate aligned syntenic blocks, light green strip indicates translocation block and light red strips indicate inversion blocks.The blocks in outer ring represent location and length of genes; blue blocks represent genes from A-genome and orange blocks represent genes from B-genome. e, Phylogenetic analysis of ACO family genes among nine species: M. acuminata, M. balbisiana, A. thaliana, O. sativa, Sorghum bicolor, Solanum lycopersicum, Phoenix dactylifera, Asparagus officinalis and B. distachyon. f, Ethylene production at different stages of fruit development and ripening in BX and FJ. Error bars show standard error of the mean from three independent experiments (n = 3).
Fig. 4
Fig. 4. Comparison of genomic expansion, evolutionary history and differential expression patterns of the starch metabolic pathway between M. acuminata (A-genome) and M. balbisiana (B-genome).
a, Overview of the starch biosynthesis and degradation pathway. b, Gene families in the starch metabolic pathway that are expanded in M. acuminata and M. balbisiana. c, Expression patterns of families AMY, BMY and DPE in the starch degradation pathway in BX, the A-subgenome of FJ and the B-subgenome of FJ during fruit-ripening stages. Horizontally oriented genes in the heat map indicate homoeologue gene pairs between the A- and B-genomes. White boxes with diagonals indicate that no homoeologue gene pairs were identified between the A- and B-genomes. Asterisks indicate expression dominance of homoeologue gene pairs between the A-subgenome of FJ and the B-subgenome of FJ. d,e, Synteny analyses of AMYs (d) and BMYs (e) between the A- and B-genomes. Red lines indicate paralogous gene pairs resulting from segmental/WGD-driven duplication, blue lines indicate homoeologous gene pairs, purple lines indicate tandem duplication, light blue strips indicate aligned syntenic blocks, light green strip indicates translocation block and light red strips indicate inversion blocks. The blocks in the outer ring represent location and length of genes; blue blocks represent genes from A-genome and orange blocks represent genes from B-genome. f, Starch contents at different stages of fruit development and ripening in BX and FJ. Error bars show standard error of the mean from three independent experiments (n = 3). g, Scanning electron microscopy of starch granules at different stages of fruit development and ripening in BX and FJ. The experiment was repeated three times independently with similar results.

Similar articles

Cited by

References

    1. D’Hont A, et al. The banana (Musa acuminata) genome and the evolution of monocotyledonous plants. Nature. 2012;488:213–217. doi: 10.1038/nature11241. - DOI - PubMed
    1. Davey MW, et al. A draft Musa balbisiana genome sequence for molecular genetics in polyploid, inter-and intra-specific Musa hybrids. BMC Genom. 2013;14:683. doi: 10.1186/1471-2164-14-683. - DOI - PMC - PubMed
    1. De Langhe E, et al. Why bananas matter: an introduction to the history of banana domestication. Ethnobot. Res. Appl. 2009;7:165–177. doi: 10.17348/era.7.0.165-177. - DOI
    1. Paul JY, et al. Golden bananas in the field: elevated fruit pro‐vitamin A from the expression of a single banana transgene. Plant Biotechnol. J. 2017;15:520–532. doi: 10.1111/pbi.12650. - DOI - PMC - PubMed
    1. Cheesman EE. Classification of the bananas. Kew Bull. 1947;2:97–117. doi: 10.2307/4109206. - DOI

Publication types