. 2019 Nov;4(11):1907-1918.
doi: 10.1038/s41564-019-0500-z. Epub 2019 Jul 15.

Full-length RNA profiling reveals pervasive bidirectional transcription terminators in bacteria

Affiliations

Full-length RNA profiling reveals pervasive bidirectional transcription terminators in bacteria

Xiangwu Ju et al. Nat Microbiol. 2019 Nov.

Abstract

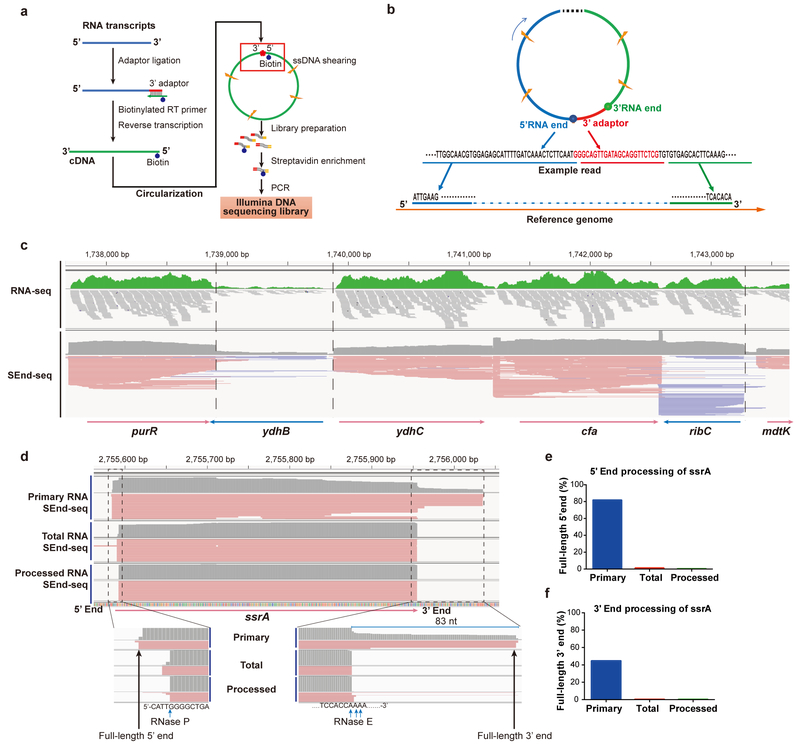
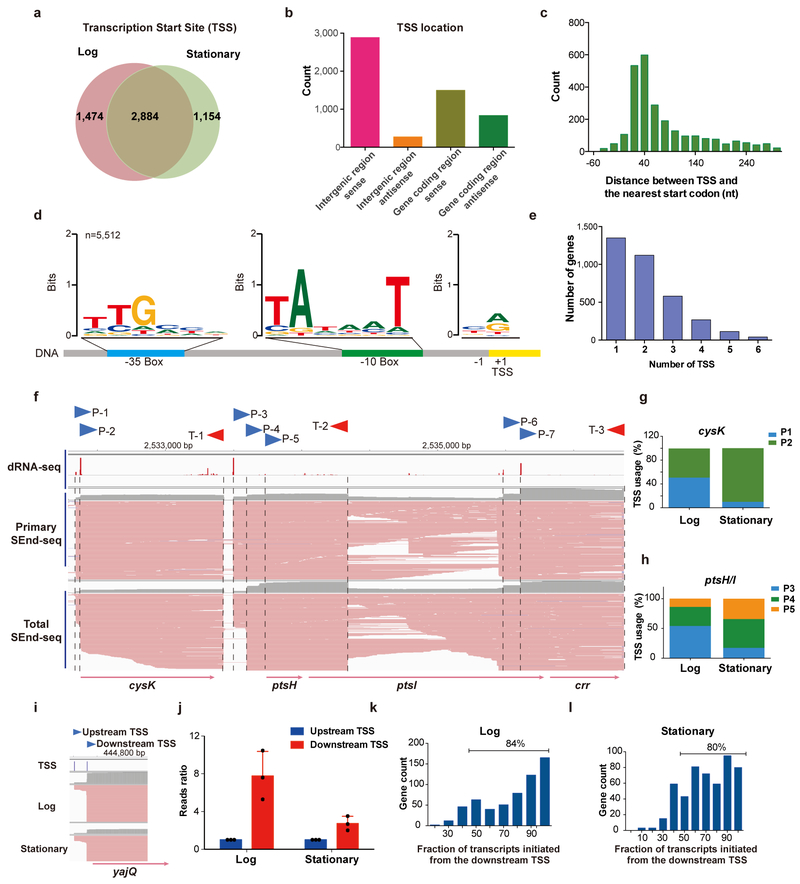
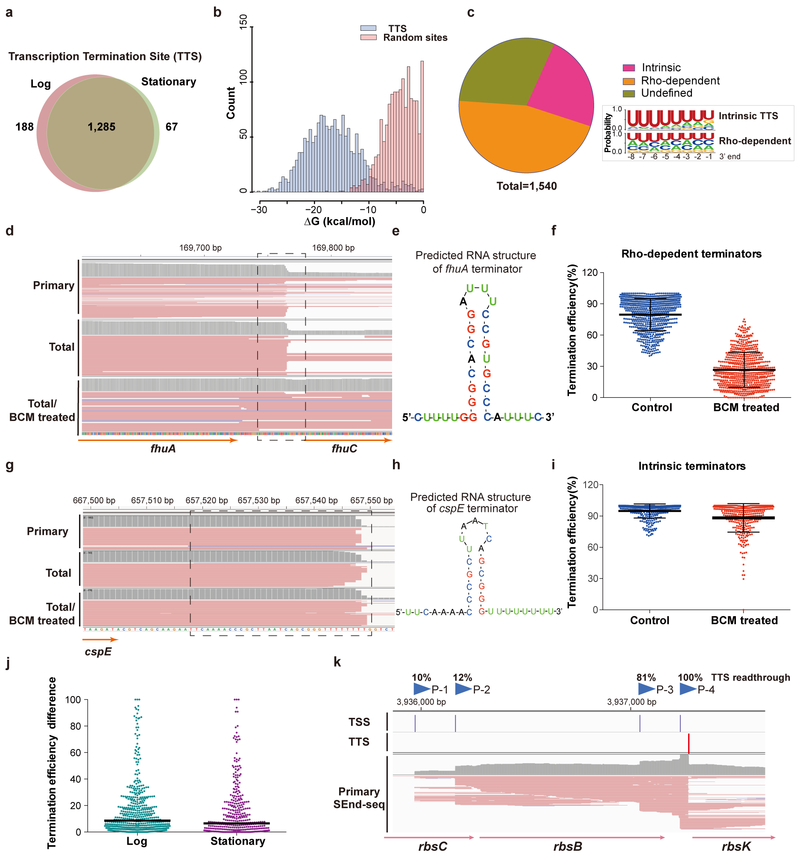
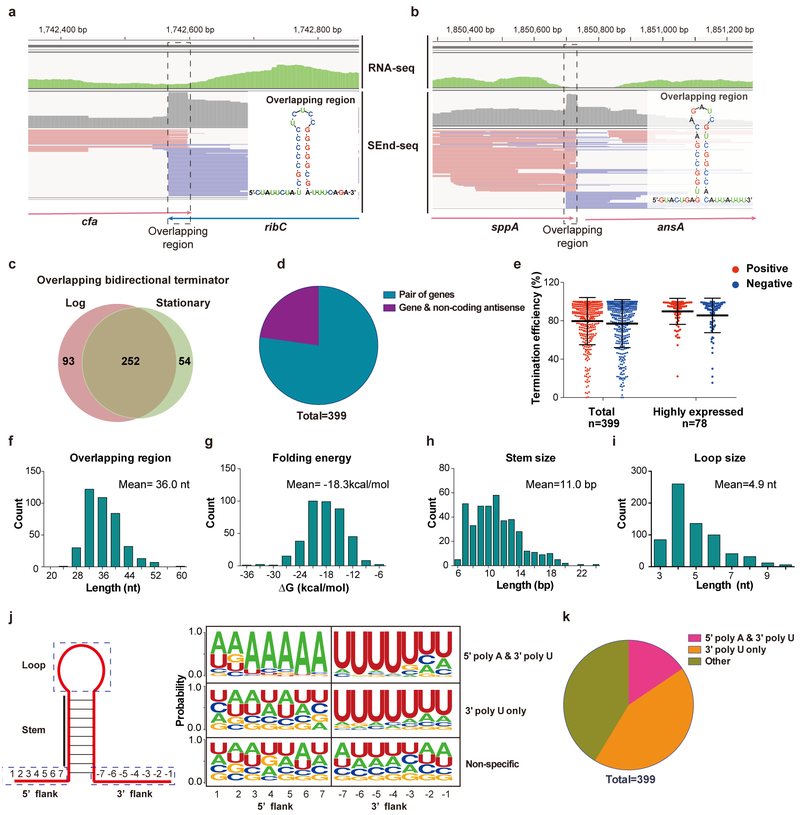
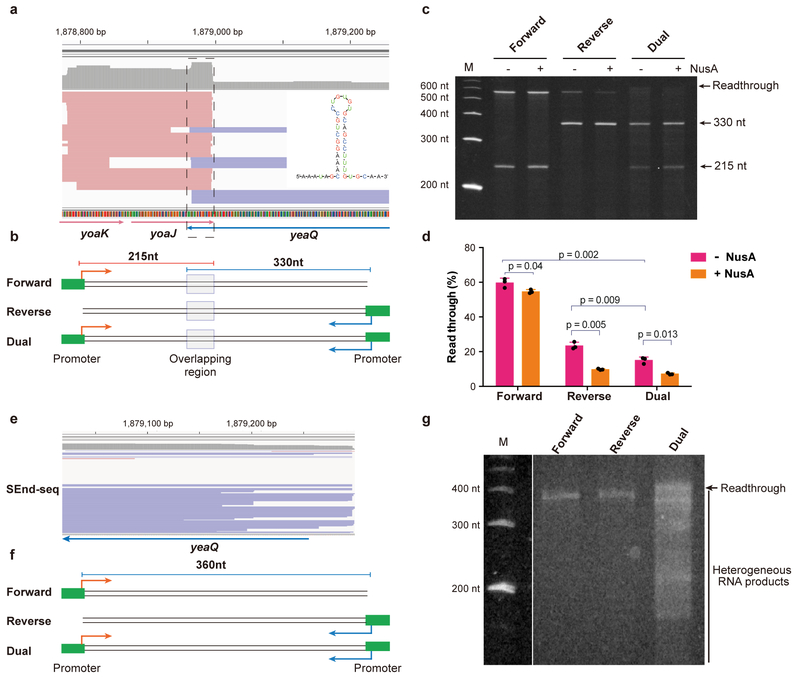
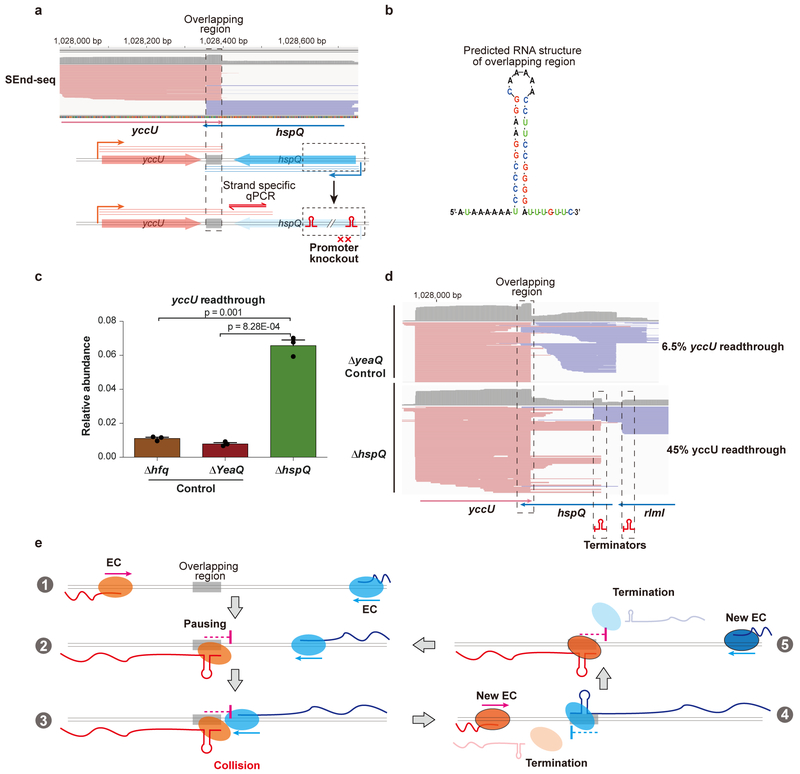
The ability to determine full-length nucleotide composition of individual RNA molecules is essential for understanding the architecture and function of a transcriptome. However, experimental approaches capable of capturing the sequences of both 5' and 3' termini of the same transcript remain scarce. In the present study, simultaneous 5' and 3' end sequencing (SEnd-seq)-a high-throughput and unbiased method that simultaneously maps transcription start and termination sites with single-nucleotide resolution-is presented. Using this method, a comprehensive view of the Escherichia coli transcriptome was obtained, which displays an unexpected level of complexity. SEnd-seq notably expands the catalogue of transcription start sites and termination sites, defines unique transcription units and detects prevalent antisense RNA. Strikingly, the results of the present study unveil widespread overlapping bidirectional terminators located between opposing gene pairs. Furthermore, it has been shown that convergent transcription is a major contributor to highly efficient bidirectional termination both in vitro and in vivo. This finding highlights an underappreciated role of RNA polymerase conflicts in shaping transcript boundaries and suggests an evolutionary strategy for modulating transcriptional output by arranging gene orientation.


Conflict of interest statement

Competing interests

The Rockefeller University has filed a provisional patent application encompassing aspects of the SEnd-seq technology on which S.L. and X.J. are listed as inventors.

Figures

Fig. 1 |
Fig. 1 |. Simultaneous capture of 5’- and 3’-end sequences of bacterial transcripts by SEnd-seq.
a, Workflow of SEnd-seq. See Methods for details. b, An example read illustrating how to infer the full-length sequence of individual transcripts by extracting correlated 5’- and 3’-end sequences and mapping them to the reference genome. c, A sample data track of the log-phase E. coli transcriptome showing the comparison between standard RNA-seq and SEnd-seq. Dashed lines highlight the sharp boundaries of transcripts delineated by SEnd-seq, which are obscured in standard RNA-seq. d, SEnd-seq reads mapped to the ssrA gene in primary, total and processed RNA datasets. e, Ratio of ssrA transcripts with an intact, unprocessed 5’ end in different datasets. f, Ratio of ssrA transcripts with an intact 3’ end in different datasets.
Fig. 2 |
Fig. 2 |. Identification of transcription start sites (TSS).
a, Venn diagram showing the number of TSS identified by SEnd-seq for E. coli cells growing in log phase versus stationary phase. b, Number of TSS located within intergenic regions or inside annotated genes (either in the sense orientation or in the antisense orientation). c, Distribution of the distance between an identified TSS and the start codon of its nearest annotated coding region (cutoff is 300 nt). d, Motif analysis of the +1 site, −10 element and −35 element from all TSS detected by SEnd-seq in log phase E. coli cells. e, Distribution of the number of alternative TSS for a given annotated gene. f, Log-phase SEnd-seq data track for the cysK-ptsH-ptsI-crr operon that shows multiple TSS (P-1 to P-7) and TTS (T-1 to T-3). TSS identified by dRNA-seq is shown on the top for comparison. g,h, Bar graphs displaying the differential usage of alternative TSS for the cysK (g) and ptsH/I (h) genes during different growth stages. i, SEnd-seq data track showing two TSS controlling the expression of the yajQ gene. j, Bar graphs displaying the amount of yajQ transcripts initiated from the upstream versus downstream TSS. Values are normalized to the upstream TSS transcript level for each experimental replicate. Data are mean ± s.d. from three independent replicates. k,l, Histogram of the percentage of detected transcripts initiated from the most downstream TSS for any gene that employ multiple TSS using cells harvested from the log phase (k) or stationary phase (l) of growth.
Fig. 3 |
Fig. 3 |. Identification of transcription termination sites (TTS).
a, Venn diagram showing the number of identified TTS for log versus stationary phase E. coli cells. b, Distribution of the RNA folding energy for identified TTS sequences (blue bars) compared with that for sequences of identical length randomly selected from the E. coli genome (red bars). c, (left) Pie chart showing the fraction of intrinsic and Rho-dependent terminators identified by SEnd-seq. (right) Nucleotide profiles for the 3’-end sequences of intrinsic and Rho-dependent TTS. Data are representative of two independent experiments. d, SEnd-seq data track for an example Rho-dependent terminator located downstream of the fhuA gene. When treated with the Rho inhibitor bicyclomycin (BCM), the fraction of readthrough transcripts significantly increased. e, Predicted secondary structure of the fhuA terminator. f, Average termination efficiency of all identified Rho-dependent terminators without or with BCM treatment. n = 709 (number of terminators analyzed). Error bars denote s.d. Data are representative of two independent experiments. g, SEnd-seq data track for an example intrinsic terminator located downstream of the cspE gene. h, Predicted secondary structure of the cspE terminator. i, Average termination efficiency of all identified intrinsic terminators without or with BCM treatment. n = 357. Error bars denote s.d. Data are representative of two independent experiments. j, Scatter plot showing the span of termination efficiency for each TTS that is linked to multiple TSS. For example, a data point at 50% means that, for this TTS, the maximal termination efficiency and the minimal efficiency—depending on the choice of TSS—differ by 50%. n = 520 for the log-phase dataset and 395 for the stationary-phase dataset. The black bars indicate median values. k, An example SEnd-seq data track illustrating that the alternative usage of TSS can induce differential termination efficiencies at the same TTS. The fractions of readthrough transcripts initiated from any given TSS (P-1 to P-4) are indicated.
Fig. 4 |
Fig. 4 |. Pervasive bidirectional overlapping TTS revealed by SEnd-seq.
a, SEnd-seq data track for an example convergent gene pair (cfa-ribC) exhibiting overlapping TTS. Standard RNA-seq data track is shown in green for comparison. (inset) Predicted secondary structure for the overlapping region. Data are representative of three independent experiments. b, SEnd-seq data track and predicted secondary structure of an example overlapping TTS between a coding gene (sppA; red reads) and a non-coding antisense RNA (blue reads). Data are representative of three independent experiments. c, Venn diagram showing the number of overlapping bidirectional terminators identified for log versus stationary phase E. coli cells. d, Pie chart showing the fraction of overlapping TTS located between a gene pair or between a gene and an antisense ncRNA. e, (left) Average termination efficiency for all identified overlapping bidirectional terminators in either orientation (positive direction in red; negative direction in blue). n = 399. (right) Average termination efficiency for those bidirectional TTS that are located between a pair of highly expressed genes. n = 78. Error bars denote s.d. Data are representative of two independent experiments. f-i, Distributions of the length (f), folding energy (g), predicted stem size (h) and loop size (i) for the overlapping TTS. j, (left) Schematic of the stem-loop structure formed in the overlapping region. (right) Nucleotide profiles for the 5’ and 3’ flanking sequences of the stem-loop within an overlapping region. Such profiling allows for classification of the overlapping TTS into three categories. k, Pie chart showing the fraction of each category described in (j).
Fig. 5 |
Fig. 5 |. Convergent transcription is required for bidirectional termination in vitro.
a, SEnd-seq data track for the yoaJ-yeaQ gene pair showing an overlapping TTS. Data are representative of three independent experiments. b, Schematic of DNA templates harboring the yoaJ-yeaQ overlapping TTS region that are used for the in vitro transcription assay. c, Gel showing the RNA products transcribed from the different templates shown in (b) in the absence or presence of NusA. Data are representative of three independent experiments. d, Quantification of the fraction of readthrough transcripts for the different templates. Data are mean ± s.d. from three independent experiments. P values were determined by two-sided unpaired Student’s t-tests. e,f, SEnd-seq data track for part of the yeaQ gene (e) and DNA templates derived from this region that lacks a terminator sequence (f). The templates contain either one or two promoters to allow unidirectional or convergent transcription, respectively. g, Gel showing predominant readthrough for unidirectional transcription (Forward and Reverse templates) and heterogeneous RNA products for convergent transcription (Dual template). Data are representative of three independent experiments.
Fig. 6 |
Fig. 6 |. Convergent transcription contributes to bidirectional termination in vivo.
a, SEnd-seq data track (top) and schematic of in vivo genomic modification (bottom) for the yccU-hspQ convergent gene pair. To disrupt hspQ transcription, we replaced the promoter and part of the gene body of hspQ with two strong intrinsic terminators. Data are representative of three independent experiments. b, Predicted secondary structure for the overlapping TTS between yccU and hspQ. c, qPCR results showing the relative abundance of yccU readthrough transcripts across the overlapping region when hspQ transcription is abolished (ΔhspQ). We also edited genes outside the convergent pair with the same procedure (Δhfq and ΔyeaQ) as controls. Data are mean ± s.d. from three independent experiments. P values were determined by two-sided unpaired Student’s t-tests. d, SEnd-seq data track around the yccU-hspQ region for the ΔyeaQ (top) or ΔhspQ strain (bottom). The fraction of yccU readthrough transcripts for each strain is indicated. Data are representative of two independent experiments. e, Model illustrating that head-on collisions between converging RNA polymerases drive bidirectional termination. The overlapping region produces an RNA hairpin that traps the transcription machinery, which is dislodged by another elongation complex traveling from the opposite direction—either through direct physical interaction or via torsional stress accumulated in the DNA. This process occurs repeatedly, resulting in highly efficient termination in both directions.

Similar articles

Cited by

References

    1. Morris KV & Mattick JS The rise of regulatory RNA. Nat Rev Genet 15, 423–37 (2014). - PMC - PubMed
    1. Wang Z, Gerstein M & Snyder M RNA-Seq: a revolutionary tool for transcriptomics. Nat Rev Genet 10, 57–63 (2009). - PMC - PubMed
    1. Sharma CM et al. The primary transcriptome of the major human pathogen Helicobacter pylori. Nature 464, 250–5 (2010). - PubMed
    1. Wurtzel O et al. A single-base resolution map of an archaeal transcriptome. Genome Res 20, 133–41 (2010). - PMC - PubMed
    1. Dar D et al. Term-seq reveals abundant ribo-regulation of antibiotics resistance in bacteria. Science 352, aad9822 (2016). - PMC - PubMed

Publication types

MeSH terms