. 2019 Aug;51(8):1272-1282.
doi: 10.1038/s41588-019-0462-3. Epub 2019 Jul 15.

Highly rearranged chromosomes reveal uncoupling between genome topology and gene expression

Affiliations

Highly rearranged chromosomes reveal uncoupling between genome topology and gene expression

Yad Ghavi-Helm et al. Nat Genet. 2019 Aug.

Abstract

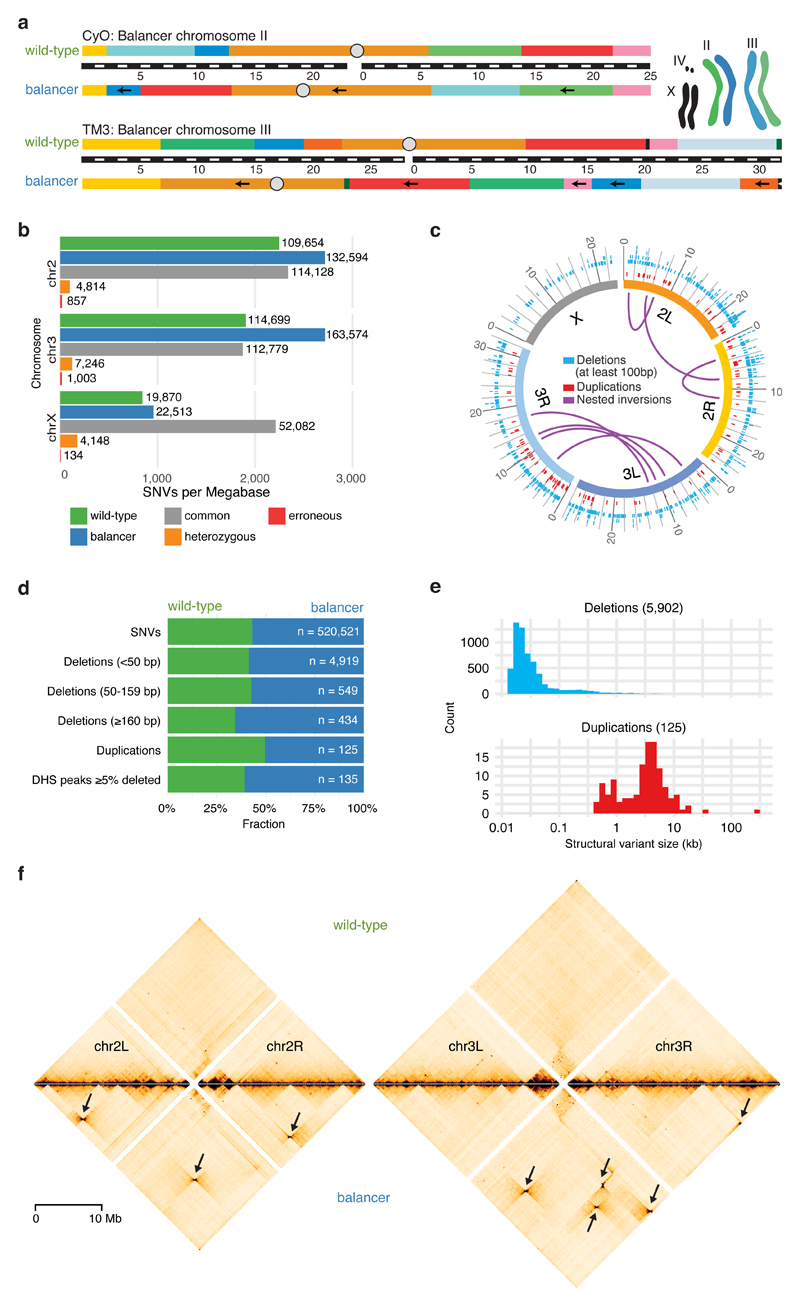
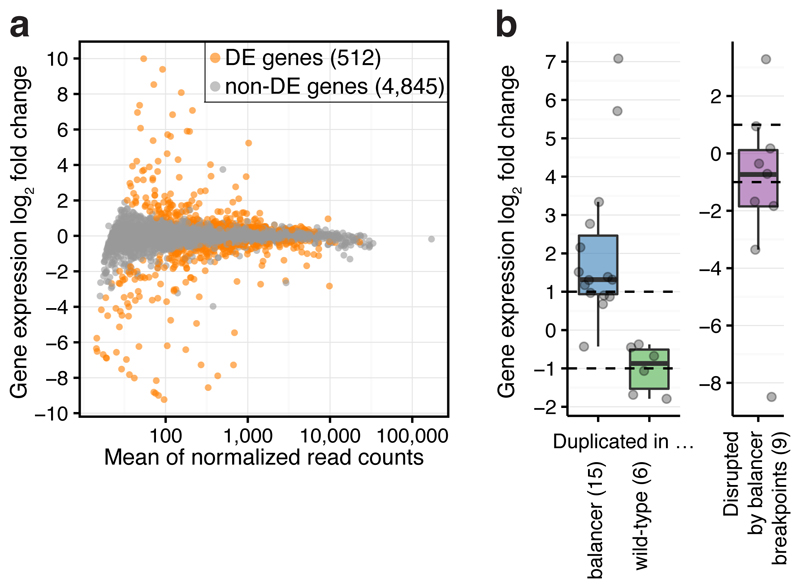
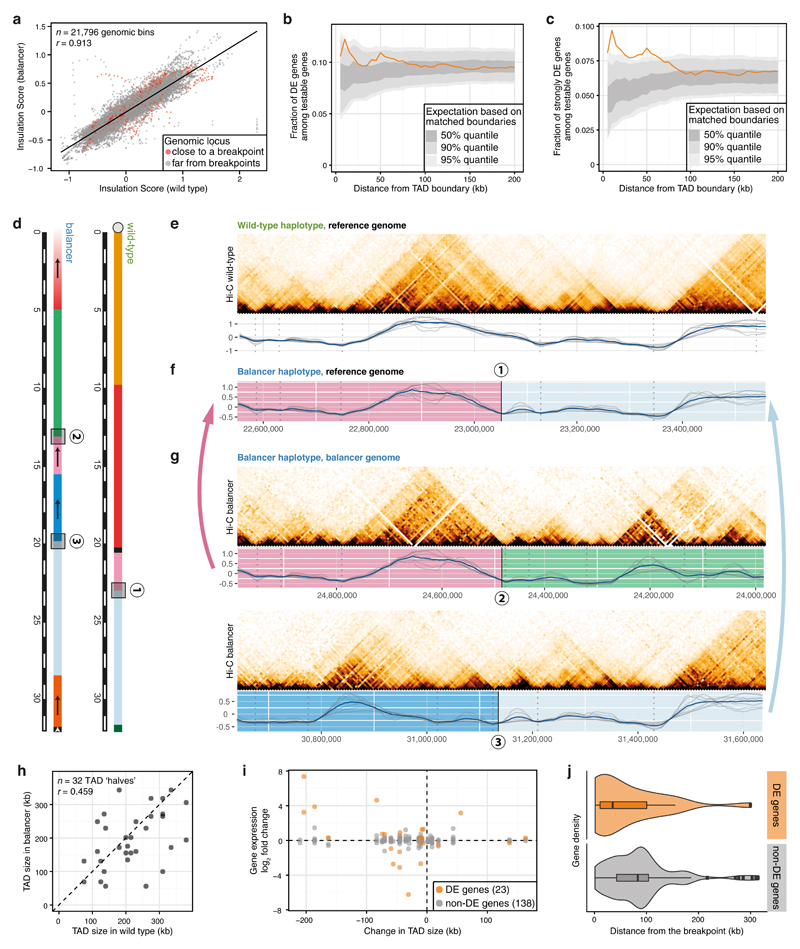
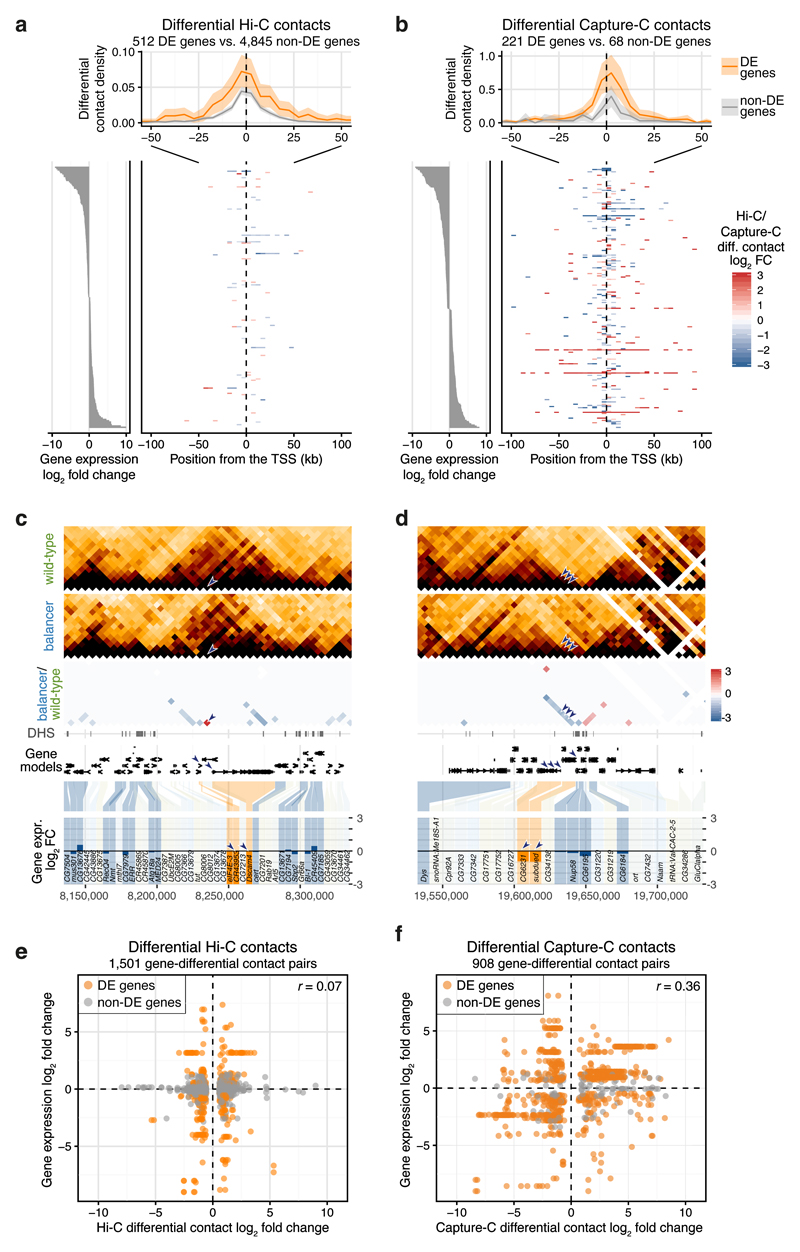
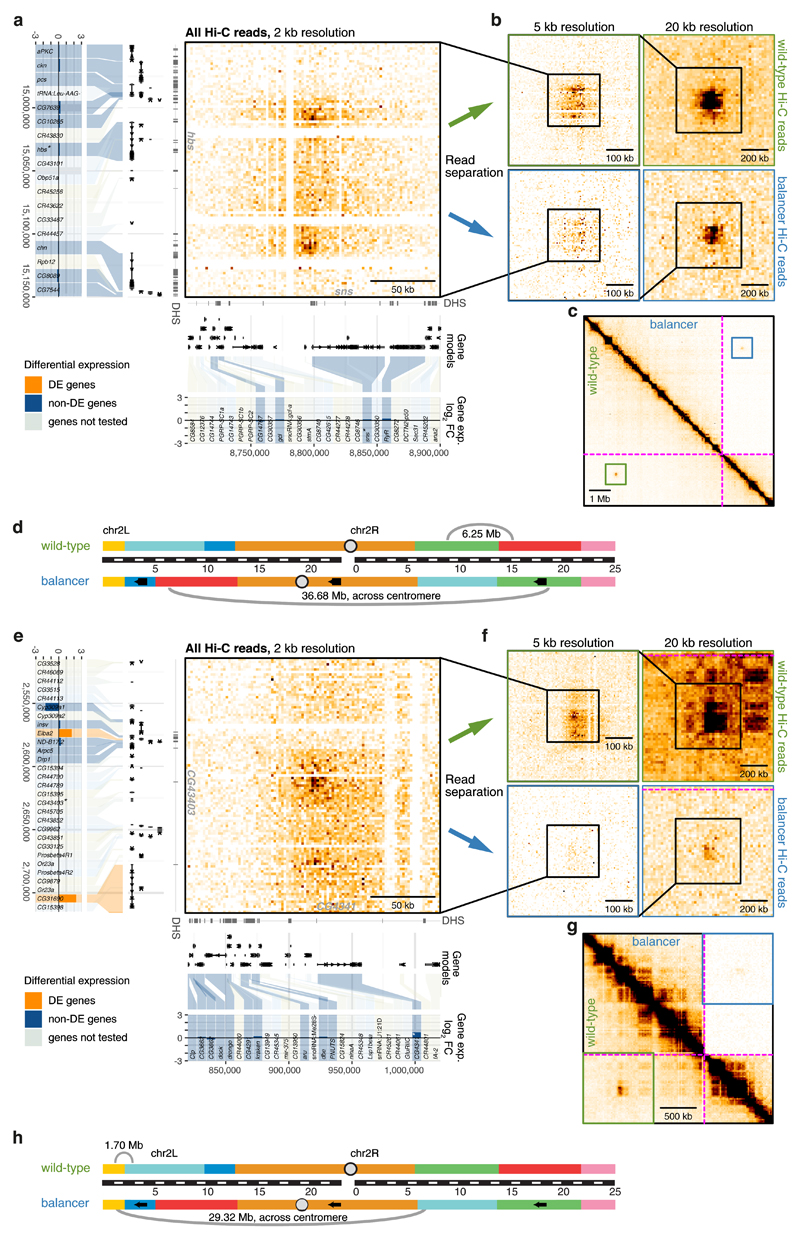
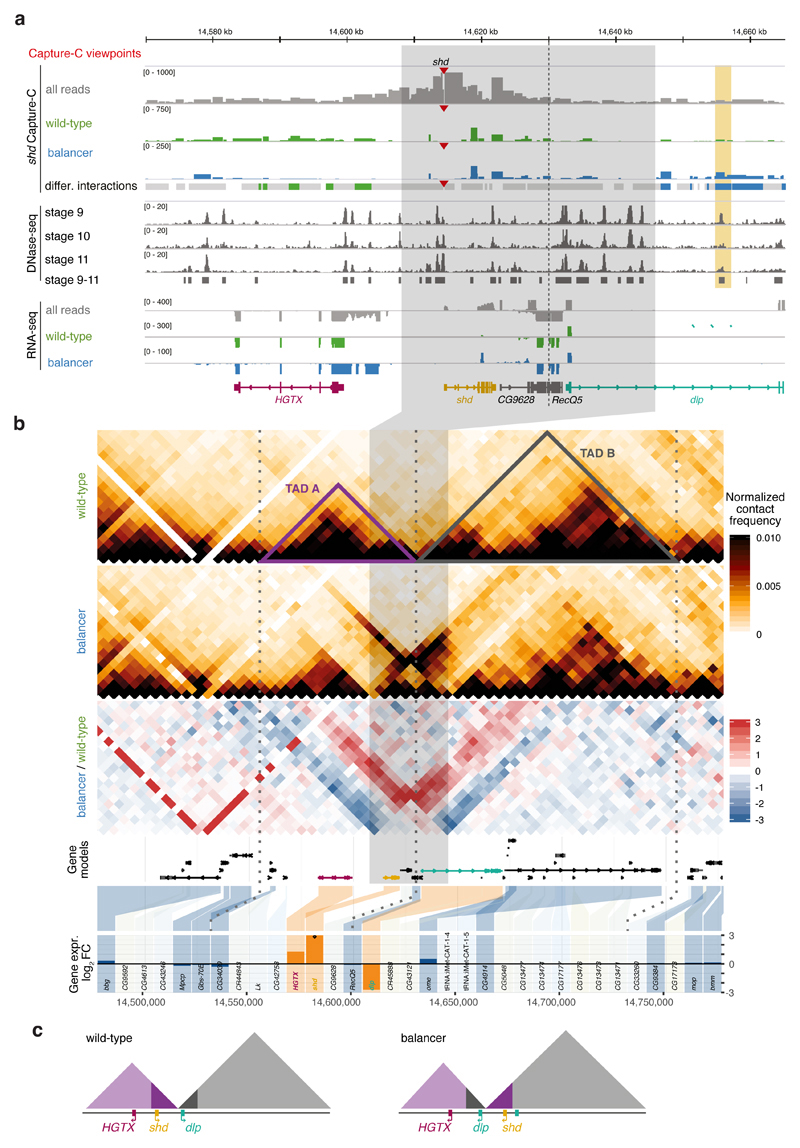
Chromatin topology is intricately linked to gene expression, yet its functional requirement remains unclear. Here, we comprehensively assessed the interplay between genome topology and gene expression using highly rearranged chromosomes (balancers) spanning ~75% of the Drosophila genome. Using transheterozyte (balancer/wild-type) embryos, we measured allele-specific changes in topology and gene expression in cis, while minimizing trans effects. Through genome sequencing, we resolved eight large nested inversions, smaller inversions, duplications and thousands of deletions. These extensive rearrangements caused many changes to chromatin topology, disrupting long-range loops, topologically associating domains (TADs) and promoter interactions, yet these are not predictive of changes in expression. Gene expression is generally not altered around inversion breakpoints, indicating that mis-appropriate enhancer-promoter activation is a rare event. Similarly, shuffling or fusing TADs, changing intra-TAD connections and disrupting long-range inter-TAD loops does not alter expression for the majority of genes. Our results suggest that properties other than chromatin topology ensure productive enhancer-promoter interactions.


Conflict of interest statement

Declaration of Interests

The authors declare no competing financial interests.

Figures

Figure 1
Figure 1. Genomic variation in balancer and wild-type chromosomes
a, Drosophila melanogaster balancer chromosomes CyO and TM3 carry multiple nested inversions. Arrows indicate segments on the balancer chromosomes that have opposite orientation compared to wild-type. Black bar with white dashes indicates chromosome size (megabases). Cartoon depicts the genotype of the heterozygous (F1) fly line used. b, Number of Single Nucleotide Variants (SNVs) specific to wild-type (green), balancer (blue), common to both haplotypes (grey), heterozygous (orange) or erroneous (red), per megabase for each chromosome. c, Circos plot representing the distribution of structural variants (deletions >100 bp (blue), duplications (red), and nested inversions (purple)) in balancer and wild-type chromosomes. Variants common to both are omitted. d, Fraction of SNVs, deletions (<50 bp, 50-159 bp, ≥160 bp), duplications, and DNase I hypersensitive peaks (DHS, deleted by ≥5% of their length) specific to wild-type (green) or balancer (blue) haplotypes. e, Size distributions of allele-specific deletions (blue) and duplications (red). f, Allele-specific Hi-C contact maps for wild-type (top) and balancer (bottom) chromosomes, relative to the reference assembly (dm6). Bowtie-shaped contacts (arrows) correspond to the nested inversions characteristic of balancer chromosomes.
Figure 2
Figure 2. The impact of chromosomal rearrangements on gene expression
a, Chromosomal rearrangements generally have a modest effect on gene expression: MA-plot of genome-wide differential gene expression between wild-type and balancer haplotypes. 512 differentially expressed (DE) genes indicated in orange (two-sided Wald test, 5% FDR). b, Change in gene expression (log2 fold change) for testable genes fully duplicated (n=21) or disrupted by balancer breakpoints (n=9). Points, individual genes; center line, median; box limits, upper and lower quartiles; whiskers, 1.5x interquartile range; dashed lines, expectation for duplications (two-fold increase or decrease).
Figure 3
Figure 3. Extensive changes in TADs have limited impact on gene expression
a, Insulation scores (averaged across different window sizes) are highly correlated between wild-type and balancer haplotypes, even close to inversion breakpoints (red). Pearson correlation coefficients (r) indicated. b-c, Fraction of all differentially expressed (DE) genes (b), or those with >1.5 fold-change (c) at varying distances from 182 perturbed TAD boundaries (orange). 50%, 90% and 95% percentiles (grey ribbons) are shown from randomly sampled matched boundaries. d, Schematic of the chr3R:23.05Mb breakpoint in the wild-type (1) and genomic sequences on each side of the breakpoint in the balancer haplotype (2 and 3). e, Top: wild-type Hi-C contact map of a 1 Mb region around the breakpoint (1) from (d). Bottom: wild-type insulation scores for 7 window sizes (50 to 195 kb; grey lines), average profile (blue) and TAD boundaries (grey dotted lines). f, Balancer insulation score profiles lifted over to the wild-type assembly for the region shown in (e). g, As in (e), but for breakpoints (2) and (3) in the balancer haplotype. h, Changes in TAD size due to inversions. Pearson correlation coefficients (r) indicated. i, Changes in TAD size do not correlate with changes in gene expression (log2 fold change) of DE-genes or non-DE genes. j, DE-genes (orange, 23 genes) in disrupted TADs are significantly closer to the inversion breakpoints than non-DE genes (grey, 138 genes). Center line, median; box limits, upper and lower quartiles; whiskers, 1.5x interquartile range; points, outliers. p = 0.017, two-sided Kolmogorov-Smirnov test.
Figure 4
Figure 4. Changes in promoter contacts and their relationship to gene expression
a-b, Top: positional distribution of differential Hi-C (a) or Capture-C (b) contacts originating from Transcription Start Sites (TSS) of differentially expressed (DE) (orange) and non-DE (grey) genes. All genes are aligned by their TSS and transcribed to the right. 95% confidence bands (shaded ribbons) estimated using bootstrapping. Bottom right: heatmap of differential contact (Hi-C, log2 fold change) for 200 randomly sampled DE-genes (a) or for all captured DE-genes (Capture-C) (b). Bottom left: expression (log2 fold change) of genes shown in the heatmap. c-d, Downregulated genes (CR43953 and Dscam4 in (c); CG6231 and subdued in (d)) have differential Hi-C contacts, either increasing, red (c) or decreasing, blue (d) proximity in the balancer. Top to bottom: wild-type and balancer Hi-C contact maps, log2 fold change before normalization (balancer/wild-type; red/blue), DNase hypersensitive sites (DHS), gene models and differential gene expression (balancer/wild-type, log2 fold change). Differentially expressed (DE-) genes in orange, non-DE genes in blue and non-tested genes (lowly expressed or lacking SNVs) in grey. Arrowheads highlight differential contacts and the affected genes. e-f, Hi-C (e) and Capture-C (f) differential contacts (log2 fold change) are plotted against changes in expression (log2 fold change) of all genes with a TSS in the two interacting genomic bins. DE-genes highlighted in orange. Pearson correlation coefficient (r) indicated.
Figure 5
Figure 5. Loss of long-range chromatin loops has little impact on gene expression
a, e, Hi-C contact map (2 kb resolution, all Hi-C reads) showing a long-range loop between hbs (left) and sns (bottom) (a) or CG43403 (left) and CG4341 (bottom) (e). The location of DNase hypersensitive sites (DHS), gene models, and differential gene expression (balancer/wild-type; log2 fold change) are shown. Differentially expressed (DE) genes in orange, non-DE genes in blue and non-tested genes (lowly expressed or lacking SNVs) in grey. b, f, Zoomed-in wild-type (top) and balancer (bottom) Hi-C contact maps at 5 kb (left) and 20 kb (right) resolution showing a slight (b) or strong (f) decrease in the strength of long-range loops. c, g, Zoomed-out Hi-C contact map showing the location of the long-range loops between sns and hbs (c) and CG4341 and CG43403 (g) in the wild-type (bottom left) and balancer (top right) haplotypes. The location of inversion breakpoints is indicated by purple dotted lines. d, h, Cartoon depicting the location, and distances, of both loops on chromosome 2 in wild-type (top) and balancer (bottom) haplotypes with respect to the inversion breakpoints.
Figure 6
Figure 6. Chromatin organization and expression around a 38kb inversion
a, Top to bottom: Capture-C tracks (all reads (grey), wild-type-specific (green), and balancer-specific (blue) reads) for the shd viewpoint (red triangle) in the vicinity of a balancer-specific inversion in chr3L (grey highlight). Dashed vertical line indicates the TAD boundary. Differential Capture-C contacts stronger in wild-type (green), balancer (blue), or not significantly changed (grey) are highlighted. DHS signal at stages 9-11, RNA expression (all reads and allele-specific) and gene models shown underneath. A differential contact is formed between the shd promoter and a DHS (vertical orange rectangle) in the balancer haplotype, observed in two independent Capture-C experiments. b, Top to bottom: Wild-type and balancer Hi-C contact maps, log2 fold change before normalization (balancer/wildtype, red/blue), gene models, and differential gene expression (balancer/wildtype, log2 fold change). Differentially expressed (DE) genes in orange, non-DE genes in blue and non-tested genes (lowly expressed or lacking SNVs) in grey. Dotted vertical lines indicate TAD boundaries. c, Model of the inversion and associated changes in TAD structure and position of three DE-genes in the balancer haplotype.

Comment in

  • A genome disconnect.
    Finn EH, Misteli T. Finn EH, et al. Nat Genet. 2019 Aug;51(8):1205-1206. doi: 10.1038/s41588-019-0476-x. Nat Genet. 2019. PMID: 31332379 Free PMC article. No abstract available.
  • Toppling TAD tenets.
    Koch L. Koch L. Nat Rev Genet. 2019 Oct;20(10):565. doi: 10.1038/s41576-019-0164-9. Nat Rev Genet. 2019. PMID: 31367009 No abstract available.

References

    1. Bulger M, Groudine M. Functional and Mechanistic Diversity of Distal Transcription Enhancers. Cell. 2011;144:327–339. - PMC - PubMed
    1. Levine M. Transcriptional Enhancers in Animal Development and Evolution. Curr Biol. 2010;20:R754–R763. - PMC - PubMed
    1. Spitz F, Furlong EEM. Transcription factors: from enhancer binding to developmental control. Nat Rev Genet. 2012;13:613–626. - PubMed
    1. Furlong EEM, Levine M. Developmental enhancers and chromosome topology. Science. 2018;361:1341–1345. - PMC - PubMed
    1. Jin F, et al. A high-resolution map of the three-dimensional chromatin interactome in human cells. Nature. 2013;503:290–294. - PMC - PubMed

Publication types