

doi: 10.1038/s41592-019-0466-z.
Epub 2019 Jul 15.
Joint analysis of heterogeneous single-cell RNA-seq dataset collections
Affiliations
- PMID: 31308548
- PMCID: PMC6684315
- DOI: 10.1038/s41592-019-0466-z
Item in Clipboard
Joint analysis of heterogeneous single-cell RNA-seq dataset collections
Nat Methods.
2019 Aug.
Abstract
Single-cell RNA sequencing is often applied in study designs that include multiple individuals, conditions or tissues. To identify recurrent cell subpopulations in such heterogeneous collections, we developed Conos, an approach that relies on multiple plausible inter-sample mappings to construct a global graph connecting all measured cells. The graph enables identification of recurrent cell clusters and propagation of information between datasets in multi-sample or atlas-scale collections.
Figures
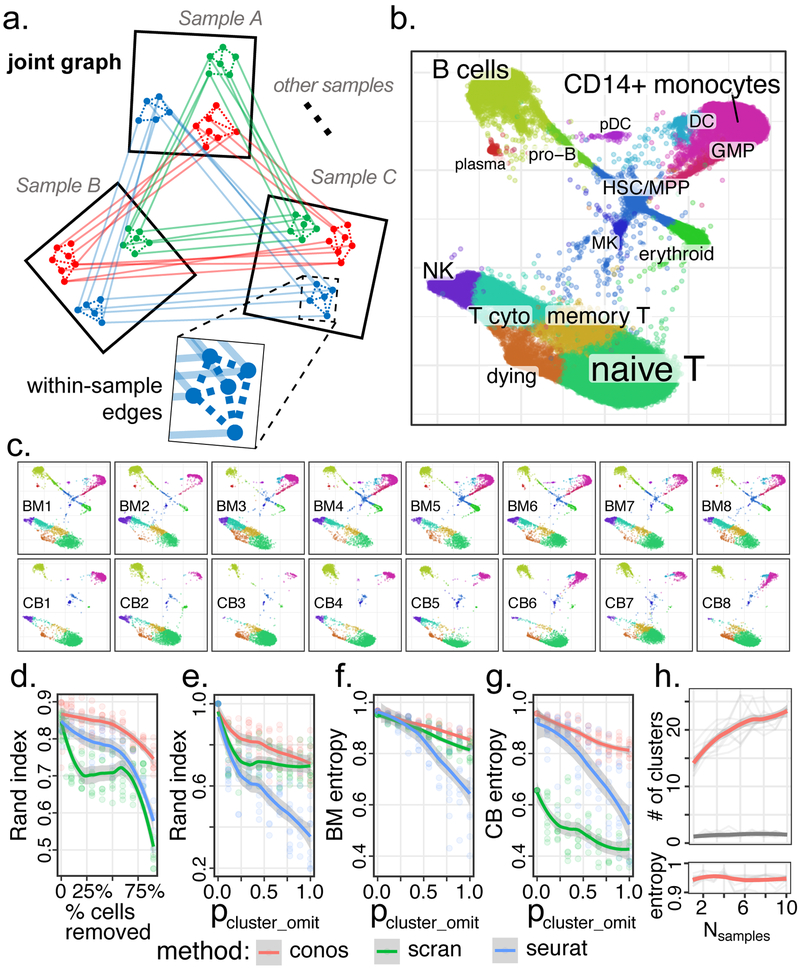
a. Conos builds joint graph by comparing all pairs of datasets. Reduced space (e.g. CPCA) is determined for each pair and the putative inter-sample edges are established using mutual-nearest neighbor mapping. Low-weight within-sample edges are also included in the graph. Subpopulations of cells recurrent within the dataset collection form clique-like communities of inter-sample edges within the joint graph. b. Joint graph combining eight human bone marrow and eight cord blood datasets is visualized using largeVis embedding. c. Visualization of each individual sample on the joint embedding. d. Adjusted Rand index (y-axis) is shown as a function of the fraction of cells omitted from the datasets (x-axis) relative to the full dataset for different joint clustering approaches. Conos shows improved stability of subpopulation detection even for small numbers of cells. e. Stability of the subpopulation detection is shown for increasing amount of heterogeneity between datasets. Adjusted Rand index is shown for increasing probability of random subpopulation omission from individual datasets (x-axis, see Methods). f,g. Mixing of different bone marrow (h) and cord blood (i) datasets within the identified subpopulations is quantified using normalized average cluster entropy (see Methods). h. The power to detect cell subpopulations increases with the size of the collection. The number of stable clusters (y axis, see Methods) detected in a collection of human bone marrow samples (red curve) increases as more samples are added to the collection (x-axis), while maintaining high level of sample mixing (high average cluster entropy) within each cluster. In contrast, addition of randomized expression datasets (grey) does not result in such increase. d-h: Mean across n=10 random replicates is shown for each point, with shading marking the 95% confidence band.
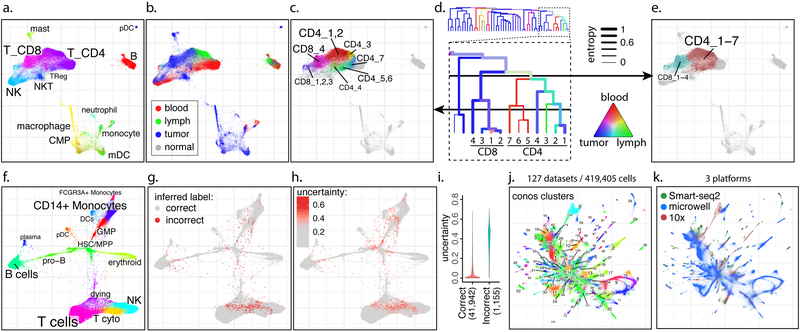
a-e. Trade-off between cluster resolution and sample breadth. Joint graph is shown for n=15 samples from eight breast cancer patients (a). The distribution of source tissues (b). A fragment of the subpopulation hierarchy is shown for T cells subsets (d), with color of the branches showing tissue composition, and width showing normalized sample entropy (higher entropy corresponds to more samples contributing to the branch). Depending on the level, a cut of the cluster hierarchy can yield more granular but tissue-specific clusters (c) or less granular clusters that incorporate more tissues and samples (e). f-i. Propagation of cell annotation labels. Joint embedding of bone marrow samples from n=8 patients is shown (f). The annotations were erased from all but one sample, and propagated back to the entire dataset. Positions of the incorrectly propagated labels (g). Uncertainty of propagation, reported by Conos (h). Reported uncertainty of correctly and incorrectly propagated labels (i). j-k. Conos integration of the Tabula Muris and Han et al. mouse atlases. Joint graph of the 127 datasets is, with colors and numbers marking top-level joint clusters (j) or scRNA-seq platforms (k).
References
Methods-only References
-
- Xin Y et al. Pseudotime Ordering of Single Human beta-Cells Reveals States of Insulin Production and Unfolded Protein Response. Diabetes 67, 1783–1794 (2018). - PubMed
Publication types
MeSH terms
Grants and funding
LinkOut - more resources
Full Text Sources
