. 2019 Jul 4:14:4867-4880.
doi: 10.2147/IJN.S204134. eCollection 2019.

Oxidized carbon nanoparticles as an effective protein antigen delivery system targeting the cell-mediated immune response

Affiliations

Oxidized carbon nanoparticles as an effective protein antigen delivery system targeting the cell-mediated immune response

Pritsana Sawutdeechaikul et al. Int J Nanomedicine. .

Abstract

Background: The demand for an effective vaccine delivery system that drives a suitable immune response is increasing. The oxidized carbon nanosphere (OCN), a negatively charged carbon nanoparticle, has the potential to fulfill this requirement because it can efficiently deliver macromolecules into cells and allows endosomal leakage. However, fundamental insights into how OCNs are taken up by antigen-presenting cells, and the intracellular behavior of delivered molecules is lacking. Furthermore, how immune responses are stimulated by OCN-mediated delivery has not been investigated. Purpose: In this study, the model protein antigen ovalbumin (OVA) was used to investigate the uptake mechanism and intracellular fate of OCN-mediated delivery of protein in macrophages. Moreover, the immune response triggered by OVA delivered by OCNs was characterized. Methods: Bone-marrow-derived macrophages (BMDMs) from mice were used to study antigen uptake and intracellular trafficking. Mice were immunized using OCN-OVA combined with known adjuvants, and the specific immune response was measured. Results: OCNs showed no cytotoxicity against BMDMs. OCN-mediated delivery of OVA into BMDMs was partially temperature independent process. Using specific inhibitors, it was revealed that intracellular delivery of OCN-OVA does not rely on phagocytosis or the clathrin- and lipid raft/caveolae-mediated pathways. Delivered OVA was found to colocalize with compartments containing MHC class I, but not with early endosomes, lysosomes, and autophagosomes. Immunization of OVA using OCNs in combination with the known adjuvant monophosphoryl lipid A specifically enhanced interferon gamma (IFNγ)- and granzyme B-producing cytotoxic T cells (CTLs). Conclusion: OCNs effectively delivered protein antigens into macrophages that localized with compartments containing MHC class I partially by the temperature independent, but not clathrin- and lipid raft/caveolae-mediated pathways. Increased CD8+ T-cell activity was induced by OCN-delivered antigens, suggesting antigen processing toward antigen presentation for CTLs. Taken together, OCNs are a potential protein antigen delivery system that stimulates the cell-mediated immune response.

Keywords: adjuvant; cell-mediated immune response; macrophages; oxidized carbon nanosphere.


Conflict of interest statement

The authors report that there are no conflicts of interest in this work.

Figures

Figure 1
Figure 1
Cytotoxicity of OCNs on macrophages and the loading capacity of OCNs. (A) BMDMs were incubated with various concentrations of OCNs (0.8, 1.5, 3, 6.3, 12.5, 25, 50, and 100 µg/mL) for 24 hrs at 37°C. Cell viability was determined by the MTT assay. The results represent the mean ± SEM of the results from three independent experiments. (B) BMDMs were incubated with the mixtures of OCN+OVA at 3:1 and 1:1 (w/w) with or without indicated adjuvant for 24 hrs at 37°C. Cell viability was determined by MTT. The result represented the mean ± SEM from four independent experiments. (C, D) Three weight ratios of OCN+OVA (1:1, 2:1, and 3:1) were determined for the OVA-loading capacity (C) and OVA adsorption efficiency (D). Data represented the means ± SD from three independent experiments. The significance of differences between the groups was determined by one-way analysis of variance (ANOVA). ***p<0.001. Abbreviations: OCN, oxidized carbon nanosphere; Poly(I:C), polyinosinic polycytidylic acid; MPL, monophosphoryl lipid A; HEPES, (4-(2-hydroxyethyl)-1-piperazineethanesulfonic acid; OVA, ovalbumin; MTT, thiazolyl blue tetrazolium bromide; PMA, phorbol myristate acetate; mβcd, methyl-ß-cyclodextrin; DMSO, dimethyl sulfoxide; w/w, weight-by-weight; EEA1, early endosomal antigen 1; LAMP1, lysosomal-associated membrane protein 1; LC3, microtubule-associated protein 1 light chain 3.
Figure 2
Figure 2
The kinetics of OVA uptake by BMDMs and the effect of temperature on the internalization of OVA delivered by OCNs. (A–B) BMDMs were incubated with OCN+OVA or OVA alone for the indicated durations. Cells were stained for detecting OVA or nuclei staining by Hoechst. (CD) J774A.1, a macrophage cell line, was treated with OCNs, OVA, and OCN+OVA (1:1 w/w ratio) for 1 hr at 37°C or 4°C. The percentage of relative cellular OVA uptake (C) and the relative median fluorescent intensities (MFI) (D) were calculated relative to that of OCN+OVA at 37°C. Data were analyzed using one-way ANOVA followed by Tukey’s multiple comparison post hoc test, which represents the mean ± SEM from four independent experiments. ***p<0.001.
Figure 3
Figure 3
The effect of inhibitors on the internalization of OVA delivered by OCNs. J774A.1 cell line was pretreated with various concentrations of cytochalasin D or mβcd for 30 mins before the addition of OCN+OVA (1:1). Cells were further incubated for another 1 hr. The percentage of relative cellular OVA uptake and the relative MFI were calculated relative to OCN+OVA without inhibitor. (A, B) The results obtained from cells treated with cytochalasin D. (C, D) The results obtained from cells treated with mβcd. The results represent the mean ± SEM from three experiments. The data were analyzed by one-way ANOVA followed by Tukey’s multiple comparison post hoc test. *p<0.05, **p<0.01, and ***p<0.001.
Figure 4
Figure 4
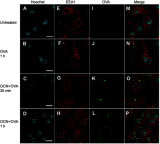
OVA delivered by OCNs did not colocalize with the endosomal compartment. OCN+OVA-fluorescein conjugate (ratio 3:1, green) were incubated with BMDMs. After 30 and 60 mins of incubation at 37°C, cells were subjected to immunofluorescence staining using rabbit monoclonal anti-EEA1 antibody and anti-rabbit IgG (H+L), F(ab’)2 fragment conjugated with Alexa Fluor® 555 for endosomes (red). Nuclei were stained with Hoechst (blue). Images were acquired by confocal microscopy. (A, E, I, M) Untreated cells, (B, F, J, N) cells incubated with OVA-fluorescein conjugate for 1 hr, (C, G, K, O) cells incubated with OCN+OVA-fluorescein conjugate for 30 mins, and (D, H, L, P) cells incubated with OCN+OVA-fluorescein conjugate for 1 hr. Scale bar =10 µm.
Figure 5
Figure 5
OVA delivered by OCNs did not colocalize with lysosomes. OCN+OVA-fluorescein conjugate (ratio 3:1, green) were incubated with BMDMs. After the indicated incubation times at 37°C, cells were subjected to immunofluorescence staining using rat anti-LAMP1 antibody and anti-rat IgG conjugated Alexa Fluor® 555 for lysosomes (red). Nuclei were stained with Hoechst (blue). Images were acquired by confocal microscopy. (A–D) Hoechst, (EH) LAMP1 (I-L) OVA-fluorescein conjugate, (MP) merged images. Scale bar =10 µm.
Figure 6
Figure 6
OVA delivered by OCNs did not colocalize with autophagosomes. OCN+OVA-fluorescein conjugate (ratio 3:1, green) were incubated with BMDMs. After the indicated incubation times at 37°C, cells were subjected to immunofluorescence staining using anti-LC3 antibody and anti-rabbit IgG (H+L), F(ab’)2 fragment conjugated with Alexa Fluor® 555 antibody for autophagosomes (red). Nuclei were stained with Hoechst (blue). Images were acquired by confocal microscopy. (AF) Hoechst, (GL) LC3, (MR) OVA-fluorescein conjugate, (SX) merged images. Scale bar=10 µm.
Figure 7
Figure 7
OCNs in combination with MPL increase the frequency of OVA-specific granzyme B+ CD8+ T cells. (A) Immunization regimen. BALB/c mice were immunized with OVA+Poly(I:C), OVA+OCN+Poly(I:C), OVA+MPL or OVA+OCN+MPL via a subcutaneous route three times with 2-week interval. One week after the last immunization, splenocytes were harvested and stimulated with OVA (200 µg/mL) in vitro for 72 hrs. Cells were collected for CD8 staining and intracellular staining for granzyme B staining. (B) The gating strategy to identify the subset of CD8+ granzyme B+ T cells is shown. (C) Representative flow cytometry results are shown. The frequency of CD8+ granzyme B+ T cells in all CD8+ T cells is summarized in (D). Data represent the mean ± SEM. The significance of differences between two groups was determined by two-tailed unpaired Student’s t-test. **p<0.01.
Figure 8
Figure 8
OCNs increased the frequency of IFNγ-producing CD8+ T cells when combined with adjuvant MPL. Splenocytes from mice treated as above were stimulated with OVA as shown in Figure 7. Cells were collected for intracellular IFN-γ staining and analyzed by flow cytometry. (A) The gating strategy to identify the subset of CD8+ FNγ+ T cells is shown. Representative flow cytometry results are shown. The frequency of CD8+ IFNγ+ T cells in all CD8+ T cells is summarized in (B). Data represent the mean ± SEM. The significance of differences between two groups was determined by two-tailed unpaired Student’s t-test. **p<0.01.
Figure 9
Figure 9
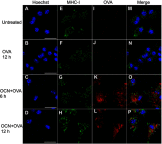
OVA delivered by OCNs colocalized with MHC-I containing compartments. OCN+OVA (ratio 3:1 ratio) were incubated with BMDMs. After the indicated incubation times at 37°C, cells were subjected to immunofluorescence staining using biotin conjugated anti-mouse H2Dd antibody and DyLight 488 conjugated streptavidin for MHC-I staining (green). OVA were detected using rabbit polyclonal anti-OVA antibody and anti-rabbit IgG antibody conjugated with Alexa Fluor® 555 (red). Nuclei were stained with Hoechst (blue). Images were acquired by confocal microscopy. (A–D) Hoechst, (E–H) MHC-I, (I–L) OVA and (M–P) the merged images. Arrow heads indicate colocalization between OVA and MHC-I (yellow). Scale bar =20 µm.

Similar articles

Cited by

References

    1. Kim BYS, Rutka JT, Chan WCW. Nanomedicine. New Engl J Med. 2010;363(25):2434–2443. doi:10.1056/NEJMoa1011205 - DOI - PubMed
    1. Clark TG, Cassidy-Hanley D. Recombinant subunit vaccines: potentials and constraints. Dev Biol (Basel). 2005;121:153–163. - PubMed
    1. Zhao L, Seth A, Wibowo N, et al. Nanoparticle vaccines. Vaccine. 2014;32(3):327–337. doi:10.1016/j.vaccine.2013.11.069 - DOI - PubMed
    1. Black M, Trent A, Tirrell M, Olive C. Advances in the design and delivery of peptide subunit vaccines with a focus on toll-like receptor agonists. Expert Rev Vaccines. 2010;9(2):157–173. doi:10.1586/erv.09.160 - DOI - PMC - PubMed
    1. Bachmann MF, Jennings GT. Vaccine delivery: a matter of size, geometry, kinetics and molecular patterns. Nat Rev Immunol. 2010;10:787. doi:10.1038/nri2868 - DOI - PubMed

MeSH terms