. 2019 Jul 4:11:6125-6138.
doi: 10.2147/CMAR.S199832. eCollection 2019.

M2 macrophage infiltration into tumor islets leads to poor prognosis in non-small-cell lung cancer

Affiliations

M2 macrophage infiltration into tumor islets leads to poor prognosis in non-small-cell lung cancer

Lili Cao et al. Cancer Manag Res. .

Abstract

Background: Lung cancer is the leading cause of cancer-related death worldwide. Although the macrophages can affect the development of tumor, the contribution of macrophages to the prognosis of non-small-cell lung cancer (NSCLC) is still controversial. Moreover, anti-PD-1 therapy can redirect macrophages from an M2 to an M1 phenotype, suggesting that tumor PD-L1 may affect the prognostic role of macrophages. Therefore, in this study, we aimed to display a macrophage landscape to clarify the function of macrophages, considering the localization and polarization of the macrophages, and evaluate the effect of M2 macrophages and tumor PD-L1 in combination on the prognosis of NSCLC. Methods: We performed multiplex quantitative immunofluorescence staining of pan-cytokeratin (CK), CD68, CD163, PD-L1, and DAPI on one tissue specimen simultaneously from 137 NSCLC patients. Results: M2 macrophages, involved marginM2 (M2 macrophages in tumor stroma), and centralM2 (M2 macrophages infiltrating into tumor islets) increased as the tumor stage increased. More macrophages were found in lung squamous cell carcinoma (LUSC) patients, patients with wild-type EGFR, and smokers than in patients with lung adenocarcinoma (LUAD), patients with EGFR mutations, and non-smokers. Infiltration of centralM2 was an independent prognostic factor of poor overall survival (OS) and disease-free survival (DFS) for NSCLC patients (P<0.05), which was superior to total macrophages and total M2 macrophages. Moreover, patients with centralM2lessPD-L1- tumors showed the best OS and DFS, while the patients with centralM2morePD-L1+ tumors showed the worst OS and DFS, and the two groups with centralM2lessPD-L1+ and centralM2morePD-L1- were in the middle (P=0.002, 0.034, respectively). Conclusion: Tumor islet-infiltrating M2 macrophages influence the prognosis of NSCLC patients. The analysis of M2 macrophages and tumor PD-L1 in combination may enhance the accuracy of prognostic prediction. This study provides a new understanding of macrophages in the development of NSCLC through the analysis of macrophage landscape.

Keywords: PD-L1; macrophage; microenvironment; non-small-cell lung cancer; polarization; prognosis.


Conflict of interest statement

The authors report no conflicts of interest in this work.

Figures
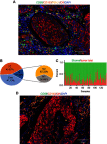
Figure 1
Figure 1
The macrophage landscape in the microenvironment of NSCLC. (A) A representative image using multiple quantitative fluorescence staining. Blue, DAPI; red, CK; green, CD68; orange, CD163; yellow, PD-L1. Scale bars =100 μm. (B) Quantity of cell subpopulations normalized to the total cell numbers in TIME. (C) Proportion of macrophage distribution in stroma (green) and tumor islets (red) of 137 patients in NSCLC microenvironment. Each column represents a patient. (D) A representative image of macrophages distributed in the tumor microenvironment. Blue, DAPI; red, CK; green, CD68; orange, CD163. Scale bars =100μm. Abbreviations: TC, tumor cells; M, total macrophages; M1, M1 macrophages; M2, M2 macrophages; NSCLC, non-small-cell lung cancer; TIME, tumor immune microenvironment.
Figure 2
Figure 2
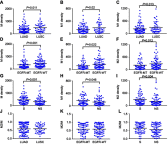
Distribution of macrophages in different tumor stages. (A-C) Represents the global distribution of macrophages. (D-F) Represents the distribution of macrophages in tumor islet. (G-I) Represents the distribution of macrophages in the stroma. Density = cell number/3.6×10, m2. P<0.05 indicates statistical significance. Abbreviations: M, total macrophages; M1, M1 macrophages; M2, M2 macrophages.
Figure 3
Figure 3
Quantity of macrophages in patients with different clinicopathological parameters. (A-C) Density of total macrophages (A), M1 macrophages (B), M2 macrophages (C) in patients with different pathological types. (D-F) Density of total macrophages (D), M1 macrophages (E), M2 macrophages (F) in patients with different EGFR status. (G-I) Density of total macrophages (G), M1 macrophages (H), M2 macrophages (I) in patients with different smoking history. (J-L) Proportion of M2 macrophages to total macrophages in patients with different pathological types (J), EGFR status (K) and smoking history (L). Density = cell number/3.6×105, m2. P<0.05 indicates statistical significance. Abbreviations: M, total macrophages; M1, M1 macrophages; M2, M2 macrophages; M2/M, Proportion of M2 macrophages to total macrophages; LUAD, lung adenocarcinoma; LUSC, lung squamous cell carcinoma; EGFR-MT, EGFR mutation; EGFR-WT, EGFR wild-type; S, smoker; NS, nonsmokers.
Figure 4
Figure 4
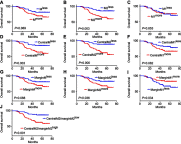
Overall survival (OS) analysis for macrophages of different polarization states and locations. Notes: (A-C) Kaplan–Meier curve of the relationship between the total macrophages (M) (A), total M2 macrophages (M2) (B), total M1 macrophages (M1) (C) and the OS of NSCLC patients. (D-F) Kaplan–Meier curve of the relationship between the macrophages infiltrating in tumor islets (centralM) (D), M2 macrophages infiltrating in tumor islets (centralM2) (E), M1 macrophages infiltrating in tumor islets (centralM1) (F) and the OS of NSCLC patients. (G-I)Kaplan–Meier curve of the relationship between the macrophages in stroma (marginM) (G), M2 macrophages in stroma (marginM2) (H), M1 macrophages in stroma (marginM1) (I) and the OS of NSCLC patients. (J)Kaplan–Meier curve of the relationship between the ratio of M2 macrophages infiltrating in tumor islets to M2 macrophages infiltrating in stroma (centralM2/marginM2) and the OS of NSCLC patients.less: low infiltration; more: high infiltration.
Figure 5
Figure 5
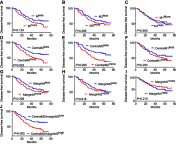
Disease-free survival analysis (DFS) for macrophages of different polarization states and locations. Notes: (A-C) Kaplan–Meier curve of the relationship between the total macrophages (M) (A), total M2 macrophages (M2) (B), total M1macrophages (M1) (C) and the DFS. (D-F) Kaplan–Meier curve of the relationship between the macrophages infiltrating in tumor islets (centralM) (D), M2 macrophages infiltrating in tumor islets (centralM2) (E), M1 macrophages infiltrating in tumor islets (centralM1) (F) and the DFS. (G-I) Kaplan–Meier curve of the relationship between the macrophages infiltrating in stroma (marginM) (G), M2 macrophages infiltrating in stroma (marginM2) (H), M1 macrophages infiltrating in stroma (marginM1) (I) and the DFS.(J)Kaplan–Meier curve of the relationship between the ratio of M2 macrophages infiltrating in tumor islets to M2 macrophages infiltrating in stroma (centralM2/marginM2) and the DFS. less: low infiltration; more: high infiltration.
Figure 6
Figure 6
Prognostic analysis of M2 macrophages and tumor PD-L1 combination of NSCLC. (A) Kaplan–Meier curve of the relationship between the combination of M2 macrophages and tumor PD-L1, and the overall survival (OS). (B) Kaplan–Meier curve of the relationship between the combination of M2 macrophages and tumor PD-L1 and the disease-free survival (DFS). (C) Kaplan–Meier curve of the relationship between the combination of centralM2 macrophages and tumor PD-L1, and the OS. (D) Kaplan–Meier curve of the relationship between the combination of marginM2 macrophages and tumor PD-L1, and the DFS. Notes: M2lessPD-L1-: low infiltration of M2 macrophages and tumor PD-L1 negative; M2lessPD-L1+: low infiltration of M2 macrophages and tumor PD-L1 positive; M2morePD-L1-: high infiltration of M2 macrophages and tumor PD-L1 negative; M2morePD-L1+: high infiltration of M2 macrophages and tumor PD-L1 positive. centralM2lessPD-L1-: low infiltration ofcentralM2 macrophages and tumor PD-L1 negative; centralM2lessPD-L1+: low infiltration of centralM2 macrophages and tumor PD-L1 positive; centralM2morePD-L1-: high infiltration of centralM2 macrophages and tumor PD-L1 negative; centralM2morePD-L1+: high infiltration of centralM2 macrophages and tumor PD-L1 positive.

References

    1. Bray F, Ferlay J, Soerjomataram I, Siegel RL, Torre LA, Jemal A. Global cancer statistics 2018: GLOBOCAN estimates of incidence and mortality worldwide for 36 cancers in 185 countries. CA Cancer J Clin. 2018;68(6):394–424. doi:10.3322/caac.21492 - DOI - PubMed
    1. Torre LA, Bray F, Siegel RL, Ferlay J, Lortet-Tieulent J, Jemal A. Global cancer statistics, 2012. CA Cancer J Clin. 2015;65(2):87–108. doi:10.3322/caac.21262 - DOI - PubMed
    1. Langer CJ, Gadgeel SM, Borghaei H, et al. Carboplatin and pemetrexed with or without pembrolizumab for advanced, non-squamous non-small-cell lung cancer: a randomised, phase 2 cohort of the open-label KEYNOTE-021 study. Lancet Oncol. 2016;17(11):1497–1508. doi:10.1016/S1470-2045(16)30498-3 - DOI - PMC - PubMed
    1. Borghaei H, Langer CJ, Gadgeel S, et al. 24-month overall survival from KEYNOTE-021 Cohort G: pemetrexed and carboplatin with or without pembrolizumab as first-line therapy for advanced nonsquamous non-small cell lung cancer. J Thorac Oncol. 2019;14(1):124–129. - PubMed
    1. Brahmer J, Reckamp KL, Baas P, et al. Nivolumab versus docetaxel in advanced squamous-cell non-small-cell lung cancer. N Engl J Med. 2015;373(2):123–135. - PMC - PubMed