. 2019 Jun 4:14:77-89.
doi: 10.1016/j.omtm.2019.05.012. eCollection 2019 Sep 13.

Enhancement of Adeno-Associated Virus-Mediated Gene Therapy Using Hydroxychloroquine in Murine and Human Tissues

Affiliations

Enhancement of Adeno-Associated Virus-Mediated Gene Therapy Using Hydroxychloroquine in Murine and Human Tissues

Laurel C Chandler et al. Mol Ther Methods Clin Dev. .

Erratum in

Abstract

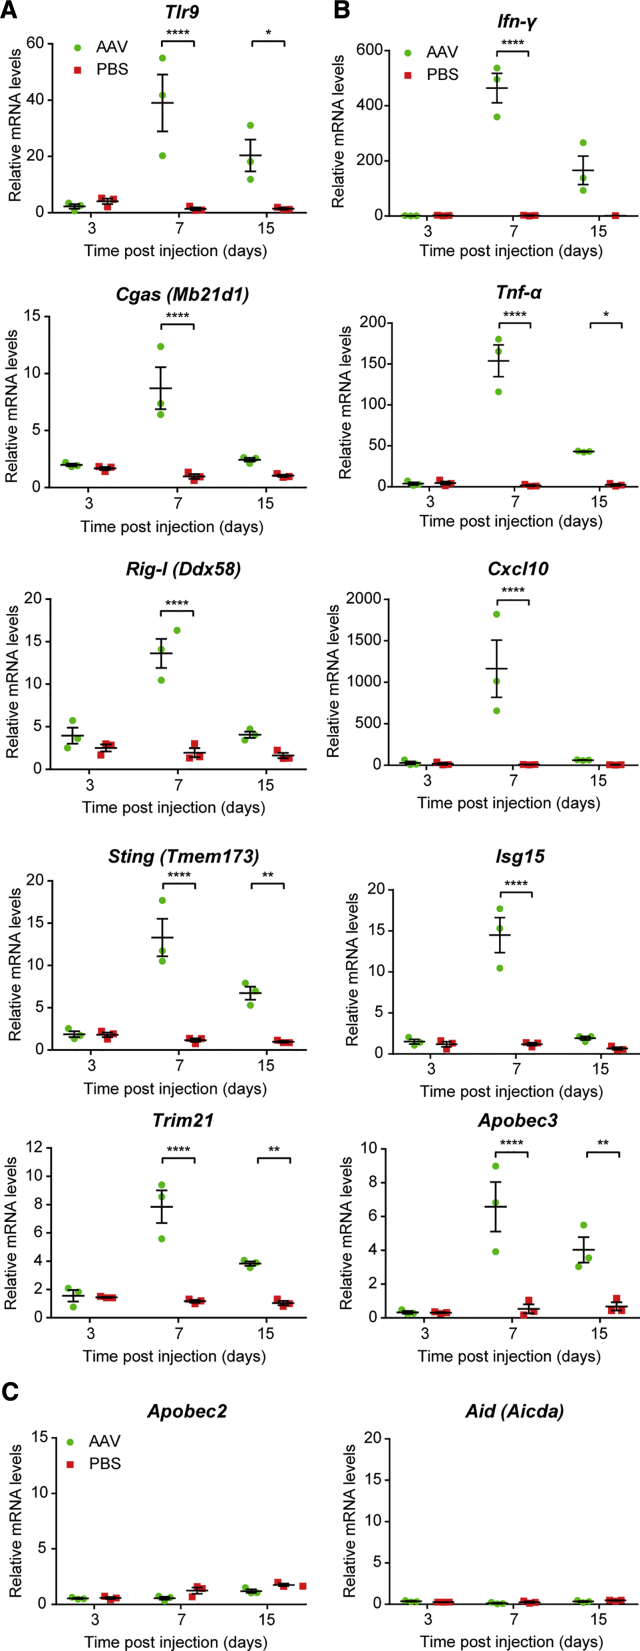
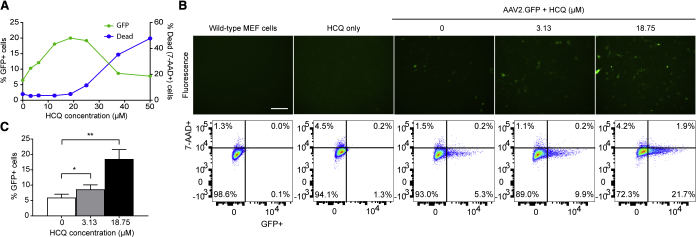
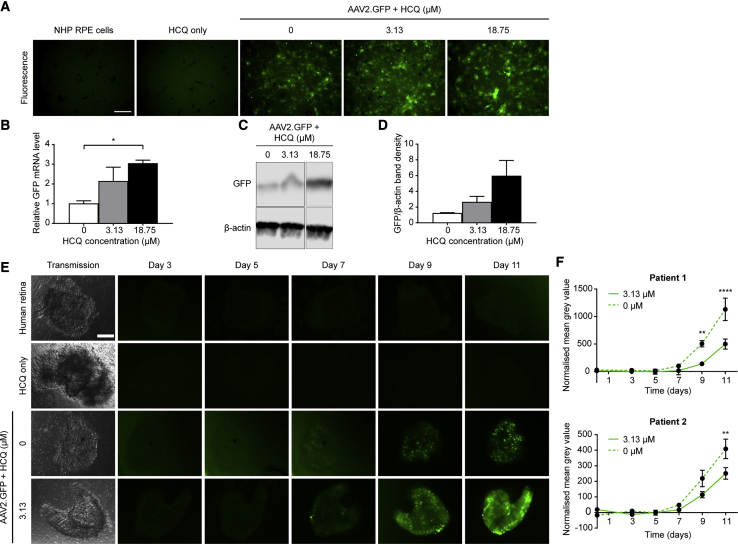
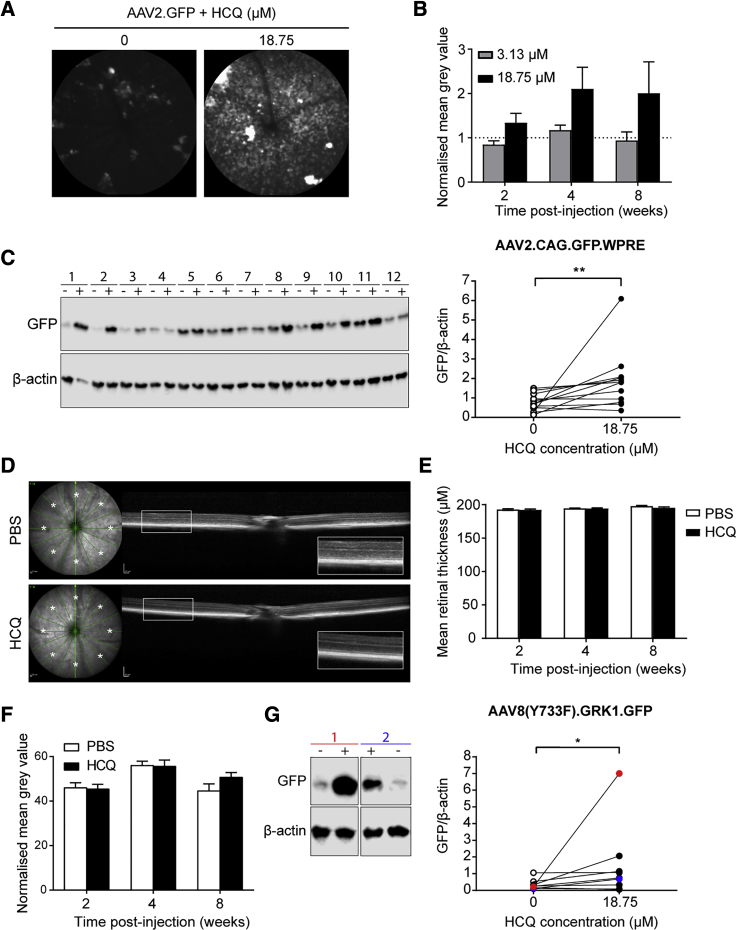
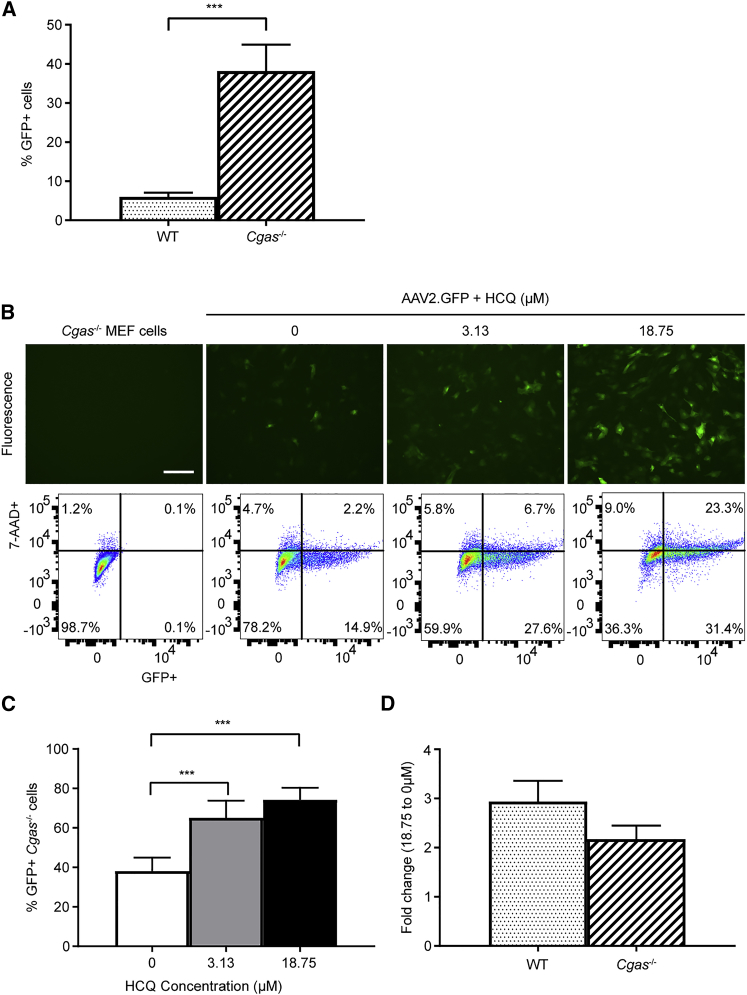
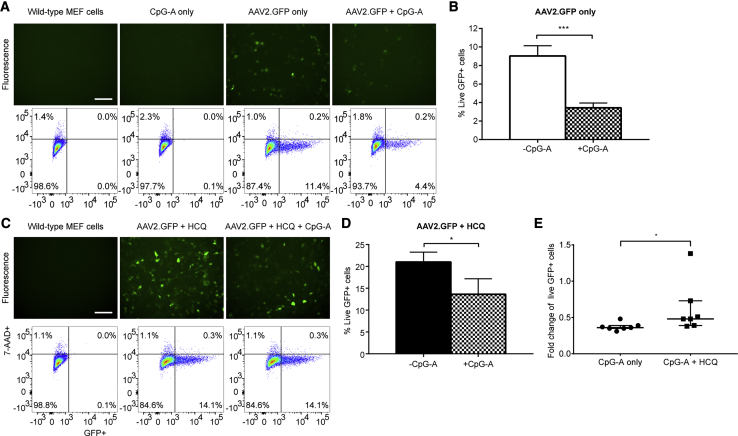
The therapeutic effects of gene therapy using adeno-associated virus (AAV) vectors are dependent on the efficacy of viral transduction. Currently, we have reached the safe limits of AAV vector dose, beyond which damaging inflammatory responses are seen. To improve the efficacy of AAV transduction, we treated mouse embryonic fibroblasts, primate retinal pigment epithelial cells, and human retinal explants with hydroxychloroquine (HCQ) 1 h prior to transduction with an AAV2 vector encoding GFP driven by a ubiquitous CAG promoter. This led to a consistent increase in GFP expression, up to 3-fold, compared with vector alone. Comparing subretinal injections of AAV2.CAG.GFP vector alone versus co-injection with 18.75 μM HCQ in paired eyes in mice, mean GFP expression was 4.6-fold higher in retinae co-treated with HCQ without retinal toxicity. A comparative 5.9-fold effect was seen with an AAV8(Y733F).GRK1.GFP vector containing the photoreceptor-specific rhodopsin kinase promoter. While the mechanism of action remains to be fully elucidated, our data suggest that a single pulse of adjunctive HCQ could safely improve AAV transduction in vivo, thus providing a novel strategy for enhancing the clinical effects of gene therapy.

Keywords: AAV; APOBEC; TLR9; Toll-like receptor 9; adeno-associated virus; cGAS; chloroquine; gene therapy; hydroxychloroquine; innate immunity.


Figures

Figure 1
Figure 1
Intracellular Innate Immune Responses Are Activated by AAV Gene Therapy AAV2.GFP vector (1 × 109 gc) was subretinally injected into wild-type C57BL/6 mice, with sham injections of PBS undertaken in the contralateral eye. RNA was extracted from the mouse retina on days 3, 7, and 15 post-injection (n = 3/time point). The expressions of a range of cytosolic anti-viral (A) sensor and (B) effector genes and (C) two genes from the APOBEC family were quantified using qRT-PCR. Relative expression was calculated as a mean fold change (±SEM) relative to the mean of both eyes from uninjected baseline controls (n = 2). *p ≤ 0.05, **p ≤ 0.01, ****p ≤ 0.0001 (two-way ANOVA with Šídák’s multiple comparison test).
Figure 2
Figure 2
Hydroxychloroquine (HCQ) Increases AAV Transduction in Mouse Embryonic Fibroblasts (MEFs) Wild-type MEFs were pre-treated with HCQ for 1 h prior to transduction with AAV2.GFP at an MOI of 1,000. (A) Representative dose-response curve of HCQ concentration versus either GFP-positive or dead (7-AAD-positive) cells, represented as a percentage of the total number of cells. (B) Representative fluorescence microscopy images of MEFs treated with 0, 3.13, or 18.75 μM HCQ acquired at 3 days post-transduction (scale bar: 200 μm), shown alongside flow cytometry analyses gated for GFP fluorescence and the cell viability marker 7-AAD. (C) Proportion of GFP-positive (GFP+) cells expressed as a percentage of the total number of live (7-AAD-negative) cells at day 3. Data are presented as mean ± SEM (n = 6). *p ≤ 0.05, **p ≤ 0.01 (one-way repeated-measures ANOVA with Dunnett’s multiple comparison test).
Figure 3
Figure 3
HCQ Increases AAV Transduction in Non-human Primate (NHP) Retinal Pigment Epithelium (RPE) Cells and Human Retina (A–D) Primary macaque RPE cells were treated with 0, 3.13, or 18.75 μM HCQ for 1 h prior to transduction with 2 × 109 gc AAV2.GFP. (A) Representative fluorescence microscopy images acquired on day 3 post-transduction (scale bar, 200 μm). (B) Levels of GFP mRNA in AAV- and HCQ-treated RPE cells were quantified using qRT-PCR on day 3 post-transduction, and they are expressed as mean fold change relative to cells treated with AAV only (±SEM, n = 3). *p ≤ 0.05 (one-way ANOVA with Dunnett’s multiple comparison test). (C) Representative western blot of GFP protein expression with β-actin used as a loading control. (D) Quantification of GFP band density normalized to β-actin. Data are presented as mean ± SEM (n = 2). (E and F) Fresh patient-derived retinal explants were treated ex vivo with 0 or 3.13 μM HCQ for 1 h prior to transduction with 1 × 109 gc AAV2.GFP (UK research ethics approval 10/H0505/8). (E) Representative transmission microscopy image at baseline and fluorescence images acquired on alternate days up to day 11 post-transduction (scale bar, 100 μm). (F) GFP expression was estimated by calculating the mean gray value of fluorescence images from two separate patients. These were normalized to untransduced controls treated with equivalent concentrations of HCQ. Data are expressed as mean ± SEM (3 replicates/patient). **p ≤ 0.01, ****p ≤ 0.0001 (two-way repeated-measures ANOVA with Šídák’s multiple comparisons test).
Figure 4
Figure 4
HCQ Enhances AAV Transduction of Mouse Retina In Vivo and Has No Detectable Effect on Retinal Architecture or Thickness (A–F) C57BL/6J mice were subretinally injected with AAV2.GFP vector alone in one eye and co-injected with either 3.13 or 18.75 μM HCQ in the fellow eye. (A) Representative in vivo confocal scanning laser ophthalmoscopy autofluorescence images of paired eyes at 8 weeks post-injection. (B) GFP fluorescence levels were estimated using the mean gray values of autofluorescence images. Eyes co-injected with HCQ were normalized to fellow AAV only-injected eyes at 2, 4, and 8 weeks post-transduction (±SEM; 3.13 μM, n = 5; 18.75 μM, n = 4). (C) Western blot of GFP protein levels in paired mouse retinae that received either AAV vector alone (−) or vector mixed with HCQ (18.75 μM) (+) at 8 weeks post-injection. β-actin was used as a loading control. Quantification of western blot GFP band density normalized to β-actin in paired eyes is shown (n = 12). (D) Representative spectral domain optical coherence tomography images from fellow eyes that received either PBS or 18.75 μM HCQ, showing normal retina lamellar architecture. Total retinal thickness was measured at points marked with an asterisk. (E) Mean total retinal thickness of points (*) at 2, 4, and 8 weeks post-injection (±SEM, n = 8). (F) Mean gray value of eyes injected with 18.75 μM HCQ alone normalized to paired PBS-injected eyes at 2, 4, and 8 weeks post-injection (±SEM, n = 8). (G) 129S2/SvHsd mice were subretinally injected with AAV8(Y733F).GRK1.GFP vector alone in one eye and co-injected with 18.75 μM HCQ in the paired eye. Representative western blot of GFP protein levels in paired retinae of two mice, with red and blue colors corresponding to points on the graph, is shown. Quantification of GFP band density normalized to β-actin in paired eyes is also shown (n = 9). *p ≤ 0.05, **p ≤ 0.01 (Wilcoxon matched-pairs signed rank test).
Figure 5
Figure 5
Cgas−/− MEFs Transduce Significantly Better Than Wild-Type Cells, and HCQ Further Enhances AAV Transduction in Cgas−/− MEFs MEFs were transduced with AAV2.GFP at an MOI of 1,000. GFP fluorescence and cell viability (7-AAD staining) were assessed on day 3 post-transduction by flow cytometry. The mean proportion of GFP-positive (GFP+) cells was expressed as a percentage of the total number of live (7-AAD-negative) cells. (A) Mean proportion of GFP+ cells in wild-type and Cgas−/− MEFs after transduction with the same MOI (±SEM, n = 6). ***p ≤ 0.001 (paired t test). (B) Representative fluorescence images and flow cytometry plots of Cgas−/− MEFs treated with 0, 3.13, or 18.75 μM HCQ 1 h prior to transduction (scale bar: 200 μm). (C) Mean proportion of GFP+ Cgas−/− cells measured using flow cytometry (±SEM, n = 6). ***p ≤ 0.001 (one-way repeated-measures ANOVA with Dunnett’s multiple comparison). (D) Fold change of mean proportion of GFP+ cells treated with 18.75 μM relative to 0 μM HCQ in wild-type and Cgas−/− MEFs. Data are presented as mean ± SEM (n = 6).
Figure 6
Figure 6
The Agonistic TLR9 Oligodeoxynucleotide CpG-A Decreases AAV Transduction in Wild-Type MEFs and Has a Significantly Reduced Effect in HCQ-Treated Cells Wild-type MEFs were treated with or without CpG-A (754.6 μM) 30 min prior to transduction with AAV2.GFP at an MOI of 1,000. GFP fluorescence and cell viability (7-AAD staining) were assessed on day 3 post-transduction by flow cytometry. (A) Representative fluorescence images and flow cytometry plots (scale bar, 200 μm). (B) The mean proportion of GFP-positive (GFP+) cells expressed as a percentage of the total number of live (7-AAD-negative) cells (±SEM, n = 7). ***p ≤ 0.001 (paired t test). (C and D) Wild-type MEFs were treated with 18.75 μM HCQ 1 h prior to transduction with AAV2.GFP, followed by treatment with or without CpG-A 30 min prior to transduction. (C) Representative fluorescence images and flow cytometry plots (scale bar, 200 μm). (D) The mean proportion of GFP+ cells (±SEM, n = 7). *p ≤ 0.05 (paired t test). (E) The fold change of transduced live GFP+ cells treated with CpG-A relative to cells with no CpG-A treatment. Cells were either treated with CpG-A alone or with CpG-A and HCQ (median ± interquartile range, n = 7). *p ≤ 0.05 (Wilcoxon matched-pairs signed rank test).

References

    1. MacLaren R.E., Groppe M., Barnard A.R., Cottriall C.L., Tolmachova T., Seymour L., Clark K.R., During M.J., Cremers F.P., Black G.C. Retinal gene therapy in patients with choroideremia: initial findings from a phase 1/2 clinical trial. Lancet. 2014;383:1129–1137. - PMC - PubMed
    1. Bainbridge J.W., Smith A.J., Barker S.S., Robbie S., Henderson R., Balaggan K., Viswanathan A., Holder G.E., Stockman A., Tyler N. Effect of gene therapy on visual function in Leber’s congenital amaurosis. N. Engl. J. Med. 2008;358:2231–2239. - PubMed
    1. Pierce E.A., Bennett J. The Status of RPE65 Gene Therapy Trials: Safety and Efficacy. Cold Spring Harb. Perspect. Med. 2015;5:a017285. - PMC - PubMed
    1. Edwards T.L., Jolly J.K., Groppe M., Barnard A.R., Cottriall C.L., Tolmachova T., Black G.C., Webster A.R., Lotery A.J., Holder G.E. Visual Acuity after Retinal Gene Therapy for Choroideremia. N. Engl. J. Med. 2016;374:1996–1998. - PMC - PubMed
    1. George L.A., Sullivan S.K., Giermasz A., Rasko J.E.J., Samelson-Jones B.J., Ducore J., Cuker A., Sullivan L.M., Majumdar S., Teitel J. Hemophilia B Gene Therapy with a High-Specific-Activity Factor IX Variant. N. Engl. J. Med. 2017;377:2215–2227. - PMC - PubMed

LinkOut - more resources