. 2019 Jul 10;5(7):eaav1165.
doi: 10.1126/sciadv.aav1165. eCollection 2019 Jul.

Cellular response to moderate chromatin architectural defects promotes longevity

Affiliations

Cellular response to moderate chromatin architectural defects promotes longevity

Ruofan Yu et al. Sci Adv. .

Abstract

Changes in chromatin organization occur during aging. Overexpression of histones partially alleviates these changes and promotes longevity. We report that deletion of the histone H3-H4 minor locus HHT1-HHF1 extended the replicative life span of Saccharomyces cerevisiae. This longevity effect was mediated through TOR signaling inhibition. We present evidence for evolutionarily conserved transcriptional and phenotypic responses to defects in chromatin structure, collectively termed the chromatin architectural defect (CAD) response. Promoters of the CAD response genes were sensitive to histone dosage, with HHT1-HHF1 deletion, nucleosome occupancy was reduced at these promoters allowing transcriptional activation induced by stress response transcription factors Msn2 and Gis1, both of which were required for the life-span extension of hht1-hhf1Δ. Therefore, we conclude that the CAD response induced by moderate chromatin defects promotes longevity.


Figures

Fig. 1
Fig. 1. RLS of histone copy variant strains.
(A) RLS of the WT (n = 81), htf1Δ (n = 51), and htf2Δ (n = 61) strains. Values in parentheses on the graph are mean RLS. (B) RLS of WT (n = 101) and hta2-htb2Δ (n = 97). (C) RLS of WT (n = 55) and htf1Δ rescue strain HTF1 (n = 51). (D) RLS of WT (n = 59) and htf2Δ rescue strain HTF2 (n = 50).
Fig. 2
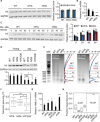
Fig. 2. Reduction in H3-H4 gene copies increases chromatin accessibility.
(A) Steady-state level of H3 protein, with glyceraldehyde phosphate dehydrogenase (GAPDH) as a loading control (left). No differences in H2B, H3, and H4 levels were found (right). Error bars here and below represent SD, unless noted otherwise. (B) qPCR analysis of H3 transcript abundance normalized against H2B transcript level. ***P < 0.001 compared to WT. (C) H3 protein levels in synchronized cells at indicated times following α-factor release. *P < 0.05 and #P < 0.001 compared to WT. (D) H3 protein levels in old and young cells. *P < 0.5; ns, not significant compared to WT. (E) MNase digestion assay with designated concentration of MNase. (F) Fold change (log2 FC) in expression of telomeric and subtelomeric genes in htf1Δ, htf2Δ, and HTF2OE strains. Error bars represent the 25 and 75% percentiles. (G) qPCR analysis of HMLα1 transcript abundance. *P < 0.05 and ***P < 0.001 compared to WT. (H) α-Factor (αF) sensitivity test. Error bars represent the 25 and 75% percentiles.
Fig. 3
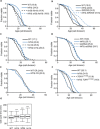
Fig. 3. Life-span extension in htf1Δ is mediated through the TOR pathway.
(A) RLS of WT (n = 51), htf1Δ (n = 50), sir2Δ fob1Δ (n = 55), and htf1Δ sir2Δ fob1Δ (n = 68). (B) RLS of WT (n = 50), htf1Δ (n = 52), SIR2OE (n = 50), and htf1Δ SIR2OE (n = 50). (C) RLS of WT (n = 62), htf1Δ (n = 50), tor1Δ (n = 63), and htf1Δ tor1Δ (n = 50). (D) RLS of WT (n = 59), htf1Δ (n = 50), rpl20bΔ (n = 50), and htf1Δ rpl20bΔ (n = 50). (E) RLS of WT (n = 50) and htf1Δ (n = 50) cells under caloric restriction (CR; 0.05% glucose), P = 0.455. (F) RLS of WT (n = 101), htf1Δ (n = 68), TOR1L2134M (n = 87), and htf1Δ TOR1L2134M (n = 100). (G) Average cell cycle duration of WT, htf1Δ, htf2Δ, and tor1Δ. ***P < 0.001 compared to WT. Error bars represent the 25 and 75% percentiles.
Fig. 4
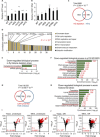
Fig. 4. Transcriptome analysis of histone deletion strains and characterization of stress-related features.
(A) GO analysis of down-regulated genes in htf1Δ. GO categories with Benjamini P < 0.05 were included here and in GO analyses below. Underlined categories are enriched in transcriptomic changes of htf1Δ and cells under CR. Numbers in all GO figures indicate fold enrichment of the corresponding category. (B) Venn diagram showing genes down-regulated in tor1Δ cells (total, 1496), in htf1Δ cells (total, 269), and in both (total, 131). (C) GO analysis of genes up-regulated in htf1Δ. (D) Overlap between stress-related category genes and genes up-regulated in htf1Δ. (E) Flow cytometry–based cell cycle analysis of indicated strains. Cells were synchronized with α-factor. (F) qPCR analysis of MRE11 and RAD51 transcript abundance. *P < 0.05 and ***P < 0.001 compared to WT. (G) Flow cytometry–based cell cycle analysis of indicated strains. Cells were unsynchronized. Percent values represent fraction of cells within the shaded region containing 1N genome.
Fig. 5
Fig. 5. Similarities between transcriptomic responses and metabolic phenotypes of htf1Δ, htf2Δ, and other chromatin regulator mutants.
(A) Relative ATP level in indicated strains. *P < 0.05, **P < 0.01, and ***P < 0.001 compared to WT. (B) COX1 copy number analysis by qPCR in indicated strains. *P < 0.05 and **P < 0.01 compared to WT. (C) Overlap in genes significantly down-regulated in H3 depletion and htf1Δ strains. (D) Deletion strains with transcriptomes demonstrating the highest-ranking correlations with the htf1Δ transcriptome. Names are provided for strains with defects in chromatin-related factors. Genes targeted by the deletion mutations are color-coded according to their molecular function. (E) GO analysis of genes down-regulated in a histone knockout fly strain. Categories expected to be affected by TOR inhibition are underlined. (F) GO analysis of genes down-regulated in CAF-1 p150 knockdown MES cells. Categories expected to be affected by TOR inhibition are underlined. (G) Down-regulated genes overlapping between CAF-1 p150 KD and INK128-treated cells. (H) GO analysis of genes down-regulated in an H2A knockdown worm. Categories expected to be affected by TOR inhibition are underlined. tRNA, transfer RNA. (I to J) Volcano plots showing up-regulation of proteolysis-related and oxidation-reduction (OR)–related genes in htf1Δ yeast cells and CAF-1 p150 KD MES cells. Red dots represent genes with significantly (false discovery rate < 0.01) up-regulated expression level. KD, knockdown.
Fig. 6
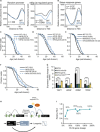
Fig. 6. Stress response factors connect CAD to longevity.
(A) Nucleosome profiles in WT and htf1Δ background cells of randomly picked 322 genes promoter regions (left). Nucleosome profiles of promoters of genes significantly up-regulated in htf1Δ (right). n, number of genes in the designated category. (B) Nucleosome profile of promoters of all yeast stress response genes as listed in table S2. (C) RLS of WT (n = 50), htf1Δ (n = 50), msn2Δ (n = 51), and htf1Δ msn2Δ (n = 50). (D) RLS of WT (n = 50), htf1Δ (n = 50), gis1Δ, (n = 50), and htf1Δ gis1Δ (n = 50). (E) RLS of WT (n = 61), htf1Δ (n = 55), MSN2OE (n = 58), and htf1Δ MSN2OE (n = 58). (F) RLS of WT (n = 50), htf1Δ (n = 52), GIS1OE (n = 50), and htf1Δ GIS1OE (n = 50). (G) Transcript levels of designated genes were measured by qPCR and normalized to the corresponding background: htf1Δ to WT, htf1Δ msn2Δ to msn2Δ, htf1Δ gis1Δ to gis1Δ, htf1Δ TOR1L2134M to TOR1L2134M. ***P < 0.001 compared to htf1Δ single deletion. (H) Model of CAD-dependent longevity. (I) Correlation between H3-H4 gene dosage and RLS obtained from this study. TSS, transcription start site.

Similar articles

Cited by

References

    1. Bell O., Tiwari V. K., Thomä N. H., Schübeler D., Determinants and dynamics of genome accessibility. Nat. Rev. Genet. 12, 554–564 (2011). - PubMed
    1. Pal S., Tyler J. K., Epigenetics and aging. Sci. Adv. 2, e1600584 (2016). - PMC - PubMed
    1. Oberdoerffer P., An age of fewer histones. Nat. Cell Biol. 12, 1029–1031 (2010). - PubMed
    1. Feser J., Truong D., Das C., Carson J. J., Kieft J., Harkness T., Tyler J. K., Elevated histone expression promotes life span extension. Mol. Cell 39, 724–735 (2010). - PMC - PubMed
    1. Postnikoff S. D. L., Johnson J. E., Tyler J. K., The integrated stress response in budding yeast lifespan extension. Microb. Cell 4, 368–375 (2017). - PMC - PubMed

Publication types

LinkOut - more resources