. 2019 Nov;62(11):2094-2105.
doi: 10.1007/s00125-019-4937-7. Epub 2019 Jul 15.

Antioxidants protect against diabetes by improving glucose homeostasis in mouse models of inducible insulin resistance and obesity

Affiliations

Antioxidants protect against diabetes by improving glucose homeostasis in mouse models of inducible insulin resistance and obesity

Leon G Straub et al. Diabetologia. 2019 Nov.

Abstract

Aims/hypothesis: In the context of diabetes, the health benefit of antioxidant treatment has been widely debated. In this study, we investigated the effect of antioxidant treatment during the development of insulin resistance and hyperphagia in obesity and partial lipodystrophy.

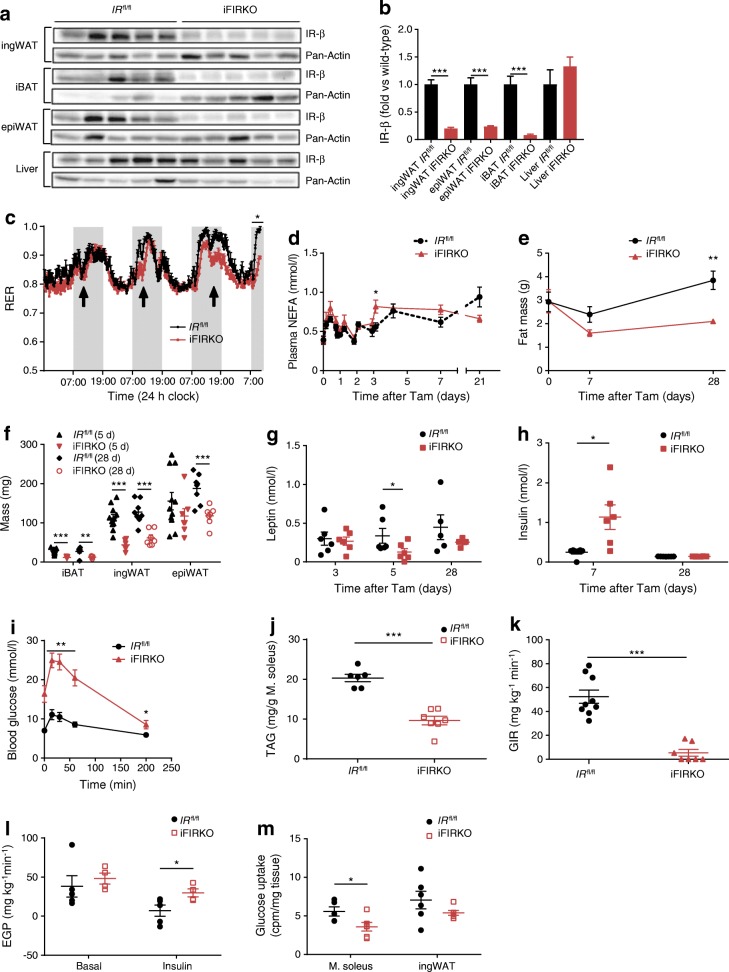
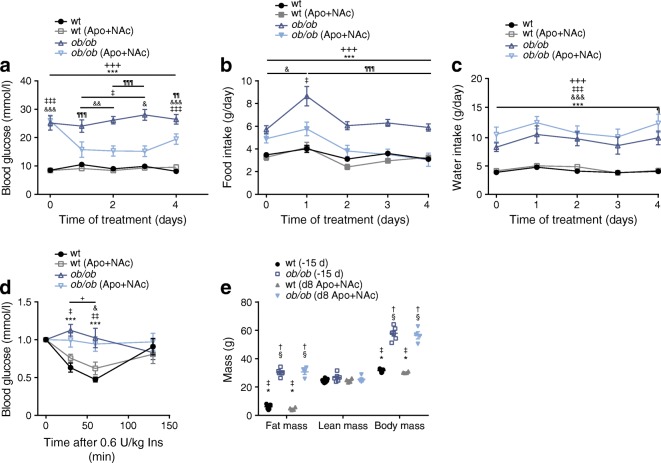
Methods: We studied the role of antioxidants in the regulation of insulin resistance using the tamoxifen-inducible fat-specific insulin receptor knockout (iFIRKO) mouse model, which allowed us to analyse the antioxidant's effect in a time-resolved manner. In addition, leptin-deficient ob/ob mice were used as a hyperphagic, chronically obese and diabetic mouse model to validate the beneficial effect of antioxidants on metabolism.

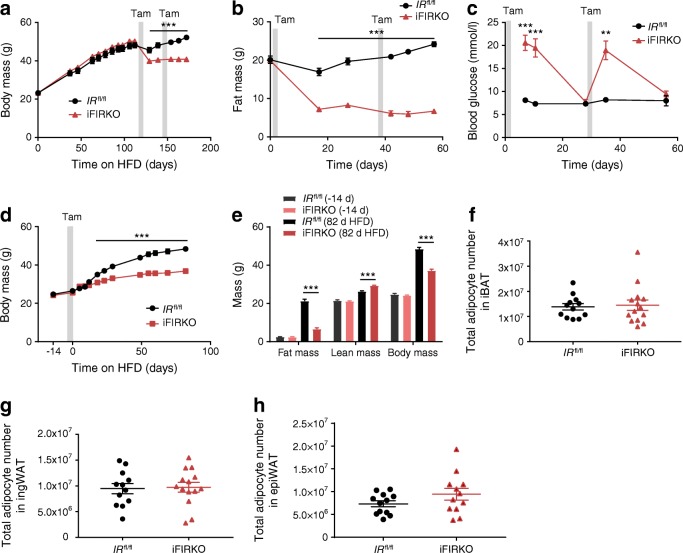
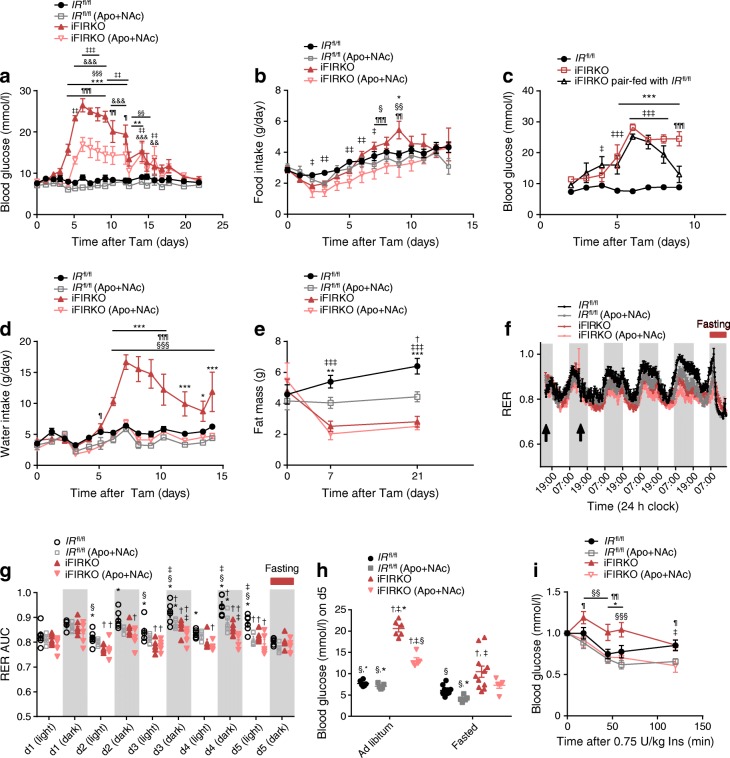
Results: Acute induction of insulin receptor knockout in adipocytes changed the substrate preference to fat before induction of a diabetic phenotype including hyperinsulinaemia and hyperglycaemia. In healthy chow-fed animals as well as in morbidly obese mice, this diabetic phase could be reversed within a few weeks. Furthermore, after the induction of insulin receptor knockout in mature adipocytes, iFIRKO mice were protected from subsequent obesity development through high-fat diet feeding. By genetic tracing we show that the persistent fat mass loss in mice after insulin receptor knockout in adipocytes is not caused by the depletion of adipocytes. Treatment of iFIRKO mice with antioxidants postponed and reduced hyperglycaemia by increasing insulin sensitivity. In ob/ob mice, antioxidants rescued both hyperglycaemia and hyperphagia.

Conclusions/interpretation: We conclude that fat mass reduction through insulin resistance in adipocytes is not reversible. Furthermore, it seems unlikely that adipocytes undergo apoptosis during the process of extreme lipolysis, as a consequence of insulin resistance. Antioxidants have a beneficial health effect not only during the acute phase of diabetes development, but also in a temporary fashion once chronic obesity and diabetes have been established.

Keywords: Acetovanillone; Adipocyte; Adipocyte quantification; Adipocyte-specific; Adipose tissue; Antioxidants; Apocynin; CreERT2; Diet-induced obesity; Fat; Hyperglycaemia; Hyperinsulinaemic–euglycaemic clamp; Hyperphagia; Insulin receptor; Insulin resistance; Leptin deficiency; Lipolysis; N-acetylcysteine; Obesity resistance; Polydipsia obesity; Tamoxifen; Type 2 diabetes; iFIRKO; ob/ob.


Figures

Fig. 1
Fig. 1
Inducible fat-specific IR knockout first reduces RER then leads to hyperinsulinaemia that correlates with hypoleptinaemia and insulin resistance, before it reduces the mass of all adipose tissue depots. (a) Western blot of IR-β and Pan-Actin in adipose tissue and liver lysates (n = 5 for IRfl/fl and iFIRKO). (b) Quantification of western blot band intensity of IR-β normalised to Pan-Actin and expressed as fold vs wild-type (IRfl/fl) in adipose tissue and liver lysates (n = 5 for IRfl/fl and iFIRKO). (c) Time course of RER (V˙CO2/V˙O2) during induction of IR knockout by tamoxifen (arrows indicate tamoxifen gavage) (n = 5 for IRfl/fl; n = 6 for iFIRKO). (d) Time course of NEFA concentration in mice fed ad libitum (n = 6–13 for IRfl/fl; n = 6 for iFIRKO). (e) Total fat mass measured by EchoMRI 0, 7 and 28 days after tamoxifen (n = 8 for IRfl/fl; n = 6 for iFIRKO). (f) iBAT, ingWAT and epiWAT wet weight 5 days (5 d) or 28 days (28 d) after tamoxifen (n = 11 for IRfl/fl (5 d); n = 6 for iFIRKO (5 d); n = 8 for IRfl/fl (28 d); n = 7 for iFIRKO (28 d)). (g) Plasma leptin concentration measured with ELISA 3, 5 and 28 days after tamoxifen (n = 5–6 for IRfl/fl; n = 5–7 for iFIRKO). (h) Plasma insulin concentration measured by ELISA 7 and 28 days after tamoxifen (n = 6–7 for IRfl/fl; n = 6–8 for iFIRKO). (i) IPGTT in 4 h-fasted iFIRKO and IRfl/fl control mice, 7 days after tamoxifen administration (n = 8 for IRfl/fl; n = 6 for iFIRKO). (j) Amount of triacylglycerol in soleus muscle, 2 weeks after tamoxifen administration (n = 6 for IRfl/fl; n = 7 for iFIRKO). (k) Glucose infusion rate during steady state of hyperinsulinaemic–euglycaemic glucose clamping in iFIRKO and IRfl/fl littermate controls (n = 9 for IRfl/fl; n = 7 for iFIRKO). (l) Endogenous glucose production rate under basal and insulin-stimulated conditions (n = 5 for IRfl/fl; n = 4 for iFIRKO). (m) Uptake of 14C-glucose per mg tissue into soleus muscle and ingWAT (n = 5–6 for IRfl/fl; n = 6 for iFIRKO). In (km) hyperinsulinaemic–euglycaemic clamps were performed 7 days after tamoxifen administration. Data are mean ± SEM. Student’s t test: *p < 0.05, **p < 0.01, ***p < 0.001 for iFIRKO vs IRfl/fl or as shown. In (i) difference is significant for all time points below the line. d, days; EGP, endogenous glucose production rate; GIR, glucose infusion rate; M. soleus, soleus muscle; TAG, triacylglycerol; Tam, tamoxifen
Fig. 2
Fig. 2
Diet-induced obese mice chronically lose fat tissue mass by induction of adipose tissue-specific IR knockout while, in parallel, mice are protected from diet-induced obesity when knockout is carried out before the initiation of HFD feeding. (a) Body mass and (b) fat mass of HFD-induced obese mice before and after induction of IR knockout by tamoxifen in adipose tissue (n = 5–16 for IRfl/fl; n = 5–16 for iFIRKO). (c) Ad libitum-fed blood glucose after two consecutive periods of induction of IR knockout in HFD-induced obese mice (n = 4–7 for IRfl/fl; n = 5–9 for iFIRKO). (d) Effect of HFD on body mass of lean mice after induction of adipose tissue-specific IR deletion (n = 11 for IRfl/fl; n = 5 for iFIRKO). (e) Evaluation of body composition and EchoMRI measurements of lean and fat mass in iFIRKO and IRfl/fl littermate controls before and after an 11 week HFD challenge. Adipose tissue-specific IR knockout was induced at the initiation of the HFD challenge (n = 11 for IRfl/fl; n = 5 for iFIRKO; d, days). (fh) Total adipocyte number in whole iBAT, ingWAT and epiWAT depots 1 week after tamoxifen induction, as measured by quantitative PCR for the evaluation of all cells that demonstrated the loxPStoploxP-tdRFP recombination (n = 12 for IRfl/fl; n = 14 for iFIRKO). Grey bars in (ad) indicate time period of tamoxifen gavage. Data are mean ± SEM. Student’s t test: **p < 0.01, ***p < 0.001 for iFIRKO vs IRfl/fl or as shown. In (a, b, d) difference is significant for all time points below the line. d, days; Tam, tamoxifen
Fig. 3
Fig. 3
Supplementation of drinking water with apocynin (Apo, 40 mmol/l) and NAc (15 mmol/l) postpones and reduces hyperglycaemia, reduces food intake and enhances insulin sensitivity. (a) Blood glucose in ad libitum-fed iFIRKO and IRfl/fl mice in either the presence or absence of Apo+NAc supplementation (n = 6 for IRfl/fl; n = 6 for IRfl/fl (Apo+NAc); n = 6 for iFIRKO; n = 5 for iFIRKO (Apo+NAc)). (b) Recording of food intake in ad libitum-fed iFIRKO and IRfl/fl mice in either the presence or absence of Apo+NAc supplementation (n = 6–13 for IRfl/fl; n = 6 for IRfl/fl (Apo+NAc); n = 6 for iFIRKO; n = 5–12 for iFIRKO (Apo+NAc)). (c) Blood glucose from pair-fed iFIRKO mice upon pair-feeding with IRfl/fl; ad libitum-fed iFIRKO mice were used as controls (n = 7 for IRfl/fl; n = 4 for iFIRKO ad libitum-fed; n = 6 for iFIRKO pair-fed). (d) Water intake in ad libitum-drinking iFIRKO and IRfl/fl mice in either the presence or absence of Apo+NAc supplementation (n = 6 for IRfl/fl; n = 6 for IRfl/fl (Apo+NAc); n = 6 for iFIRKO; n = 5 for iFIRKO (Apo+NAc)). (e) Fat mass measured with EchoMRI in iFIRKO and IRfl/fl mice either in the presence or absence of Apo+NAc supplementation (n = 6 for IRfl/fl; n = 6 for IRfl/fl (Apo+NAc); n = 6 for iFIRKO; n = 5 for iFIRKO (Apo+NAc)). (f) RER (V˙CO2/V˙O2) time course (adipose tissue-specific IR knockout was induced where indicated with the arrows) and (g) RER AUC of dark/light cycle for iFIRKO and IRfl/fl mice in either the presence or absence of Apo+NAc supplementation (n = 6 for IRfl/fl; n = 5 for iFIRKO); d, day. (h) Blood glucose levels in ad libitum-fed and fasted iFIRKO and IRfl/fl mice in either the presence or absence of Apo+NAc supplementation (n = 6–11 for IRfl/fl; n = 5 for IRfl/fl (Apo+NAc); n = 6–11 for iFIRKO; n = 5 for iFIRKO (Apo+NAc). (i) ITT using 0.75 U insulin per kg body mass (n = 6–11 for IRfl/fl; n = 5 for IRfl/fl (Apo+NAc); n = 5 for iFIRKO; n = 6–11 for iFIRKO (Apo+NAc)). Data are mean ± SEM. Two-way ANOVA with Tukey’s multiple comparisons test: in (a, b, d, e, g–i) p < 0.05 for IRfl/fl vs IRfl/fl (Apo+NAc); *p < 0.05, **p < 0.01, ***p < 0.001 for IRfl/fl vs iFIRKO; p < 0.05, ‡‡p < 0.01, ‡‡‡p < 0.001 for IRfl/fl vs iFIRKO (Apo+NAc); §p < 0.05, §§p < 0.01, §§§p < 0.001 for IRfl/fl (Apo+NAc) vs iFIRKO; p < 0.05, ¶¶p < 0.01, ¶¶¶p < 0.001 for iFIRKO vs iFIRKO (Apo+NAc), &&p < 0.01, &&&p < 0.001 for IRfl/fl (Apo+NAc) vs iFIRKO (Apo+NAc). In (c) ***p < 0.001 for IRfl/fl vs iFIRKO; p < 0.05, ‡‡‡p < 0.001 for IRfl/fl vs iFIRKO pair-fed; ¶¶¶p < 0.001 for iFIRKO vs iFIRKO pair-fed. In (ad and i) difference is significant for all time points below the line. d, day; Ins, insulin; Tam, tamoxifen
Fig. 4
Fig. 4
Supplementation of drinking water with apocynin (Apo, 40 mmol/l) and NAc (15 mmol/l) reduces hyperphagia and improves glucose homeostasis in leptin-deficient ob/ob mice. Apo+NAc supplementation was continuous and started on day 0 after measurement. (a) Blood glucose levels in ad libitum-fed ob/ob mice during treatment with antioxidants (n = 9 for wt; n = 8 for wt (Apo+NAc); n = 7 for ob/ob; n = 8 for ob/ob (Apo+NAc)). (b) Daily food intake in ob/ob mice during antioxidant treatment (n = 9 for wt; n = 8 for wt (Apo+NAc); n = 6 for ob/ob; n = 9 for ob/ob (Apo+NAc)). (c) Daily water intake in ob/ob mice during antioxidant treatment (n = 11 for WT; n = 11 for WT (Apo+NAc); n = 4 for ob/ob; n = 3 for ob/ob (Apo+NAc)). (d) ITT blood glucose over time, in min, after intraperitoneal injection of 0.6 U insulin per kg after 8 h fasting. Values normalised to blood glucose levels at injection (n = 6 for WT; n = 7 for WT (Apo+NAc); n = 7 for ob/ob; n = 8 for ob/ob (Apo+NAc)). (e) Body composition 15 days (−15 d) before and 8 days after (d8) antioxidant treatment (n = 7 for wt (−15 d); n = 4 for wt (d8 Apo+NAc); n = 6 for ob/ob (−15 d); n = 4 for ob/ob (d8 Apo+NAc). Data are mean ± SEM. Two-way ANOVA with Tukey’s multiple comparisons test: in (ad) *p < 0.05, ***p < 0.001 for wt vs ob/ob; p < 0.05, ‡‡p < 0.01, ‡‡‡p < 0.001 for wt vs ob/ob (Apo+NAc); +p < 0.05, +++p < 0.001 for wt (Apo+NAc) vs ob/ob; p < 0.05, ¶¶p < 0.01, ¶¶¶p < 0.001 for ob/ob vs ob/ob (Apo+NAc); &p < 0.05, &&p < 0.01, &&&p < 0.001 for wt (Apo+NAc) vs ob/ob (Apo+NAc). In (e) p < 0.05 vs wt (−15 d); p < 0.05 vs ob/ob (−15 d); §p < 0.05 vs wt (d8 Apo+NAc); *p < 0.05 vs ob/ob (d8 Apo+NAc). In (ad) difference is significant for all time points below the line. d, day; Ins, insulin; WT, wild-type

Similar articles

Cited by

References

    1. Collaborators GBDO, Afshin A, Forouzanfar MH, et al. Health effects of overweight and obesity in 195 countries over 25 years. N Engl J Med. 2017;377(1):13–27. doi: 10.1056/NEJMoa1614362. - DOI - PMC - PubMed
    1. O’Rahilly S. Insights into obesity and insulin resistance from the study of extreme human phenotypes. Eur J Endocrinol. 2002;147(4):435–441. doi: 10.1530/eje.0.1470435. - DOI - PubMed
    1. Softic S, Boucher J, Solheim MH, et al. Lipodystrophy due to adipose tissue-specific insulin receptor knockout results in progressive NAFLD. Diabetes. 2016;65(8):2187–2200. doi: 10.2337/db16-0213. - DOI - PMC - PubMed
    1. George S, Rochford JJ, Wolfrum C, et al. A family with severe insulin resistance and diabetes due to a mutation in AKT2. Science. 2004;304(5675):1325–1328. doi: 10.1126/science.1096706. - DOI - PMC - PubMed
    1. Roden M, Price TB, Perseghin G, et al. Mechanism of free fatty acid-induced insulin resistance in humans. J Clin Invest. 1996;97(12):2859–2865. doi: 10.1172/Jci118742. - DOI - PMC - PubMed

Publication types

MeSH terms