. 2019 Oct;8(10):e902.
doi: 10.1002/mbo3.902. Epub 2019 Jul 16.

Expression of different ParE toxins results in conserved phenotypes with distinguishable classes of toxicity

Affiliations

Expression of different ParE toxins results in conserved phenotypes with distinguishable classes of toxicity

Jessica R Ames et al. Microbiologyopen. 2019 Oct.

Abstract

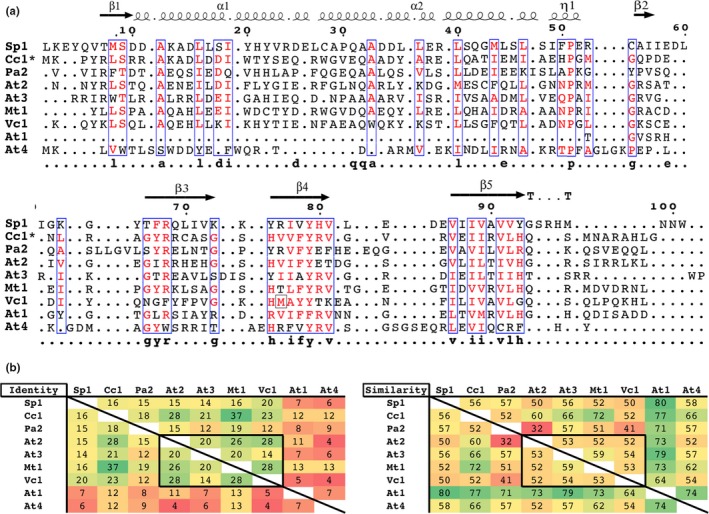
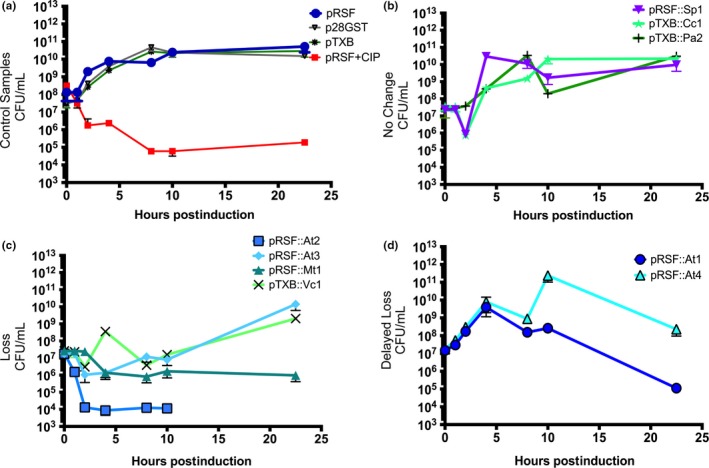
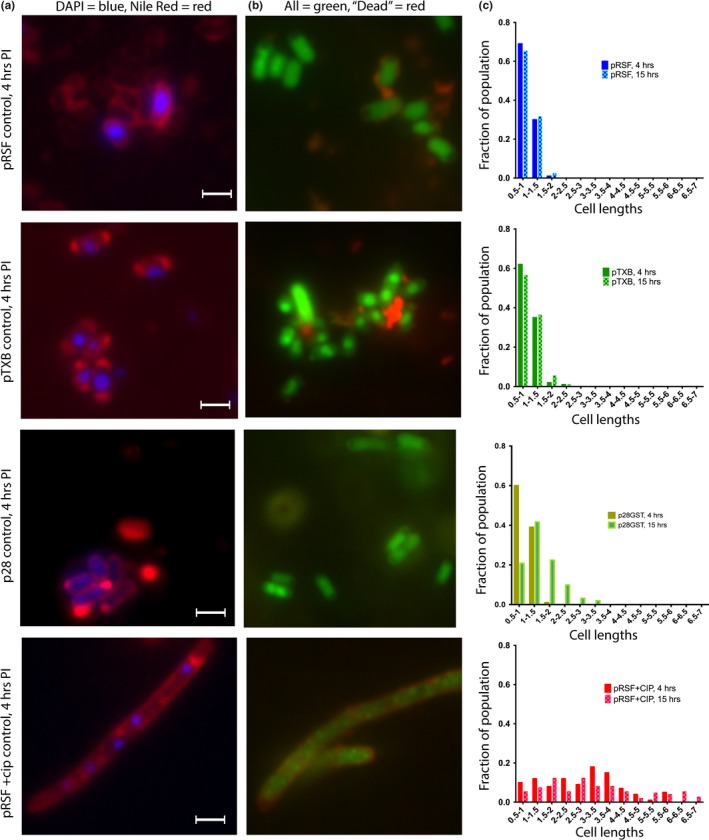
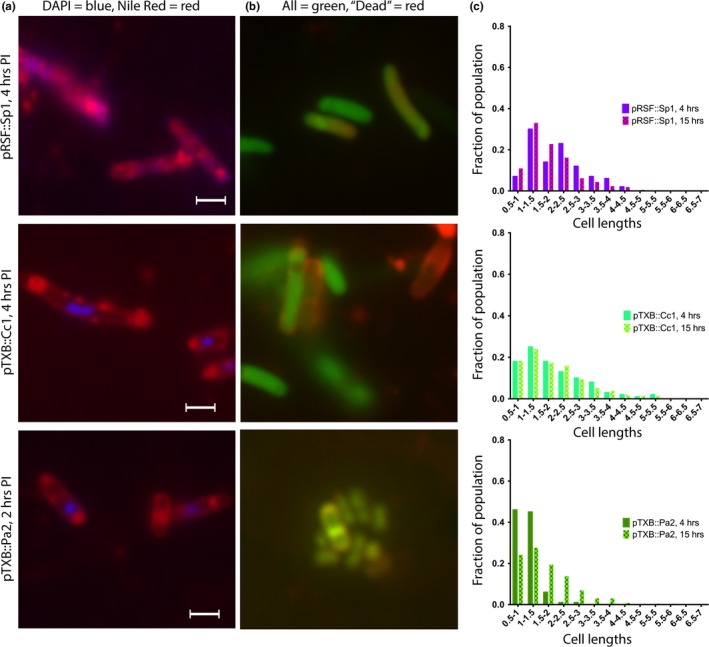
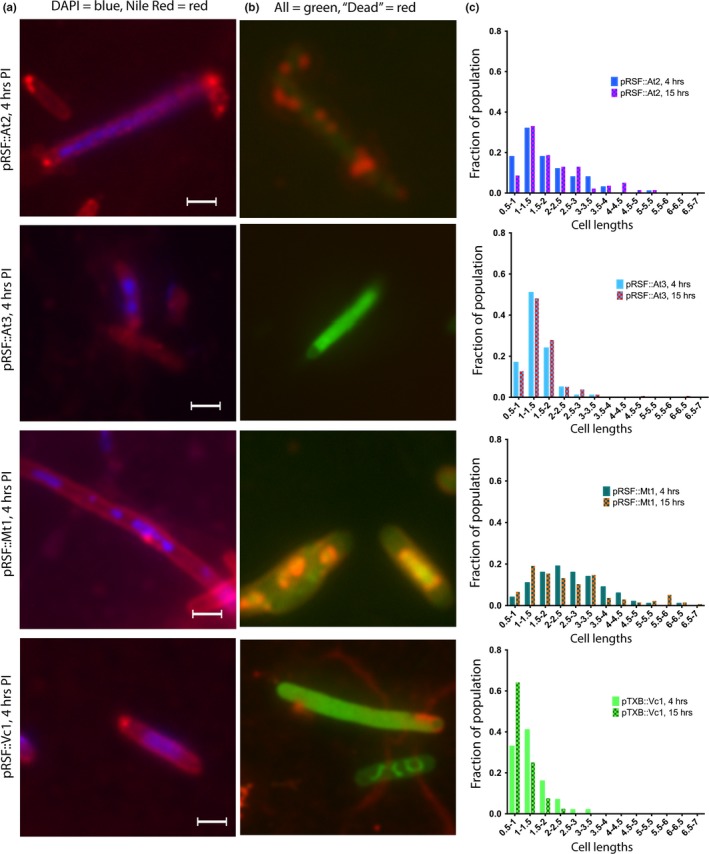
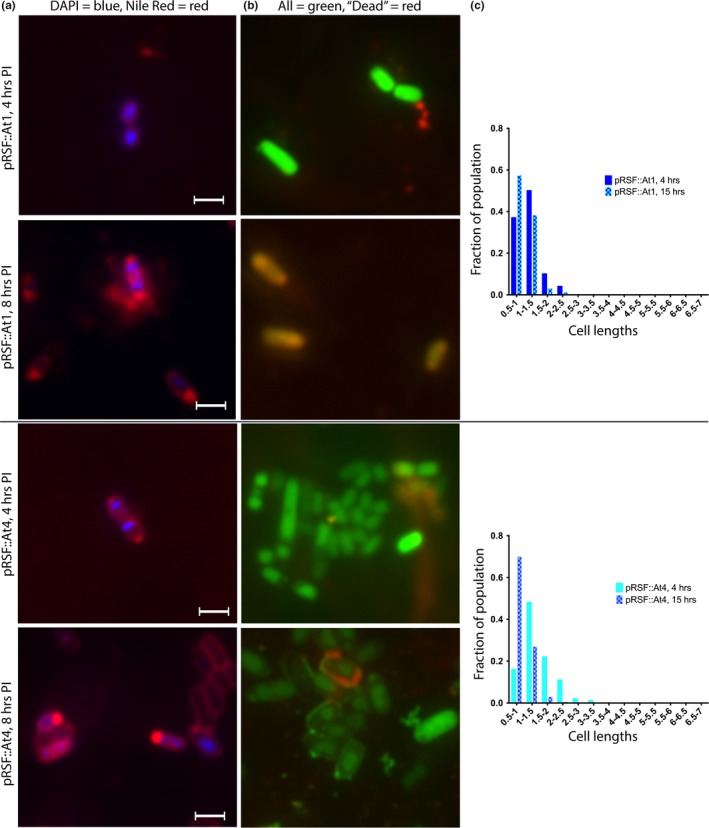
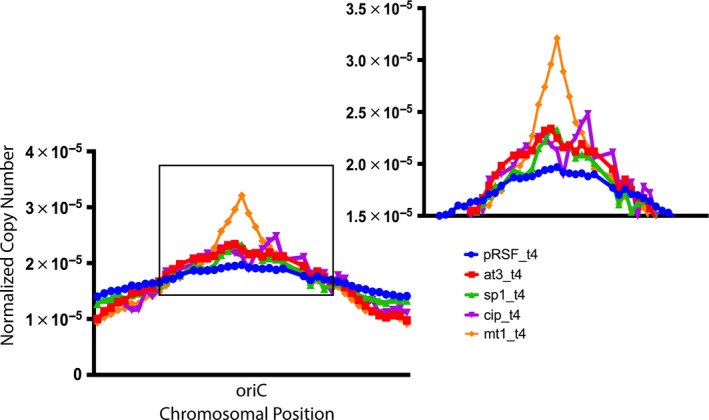
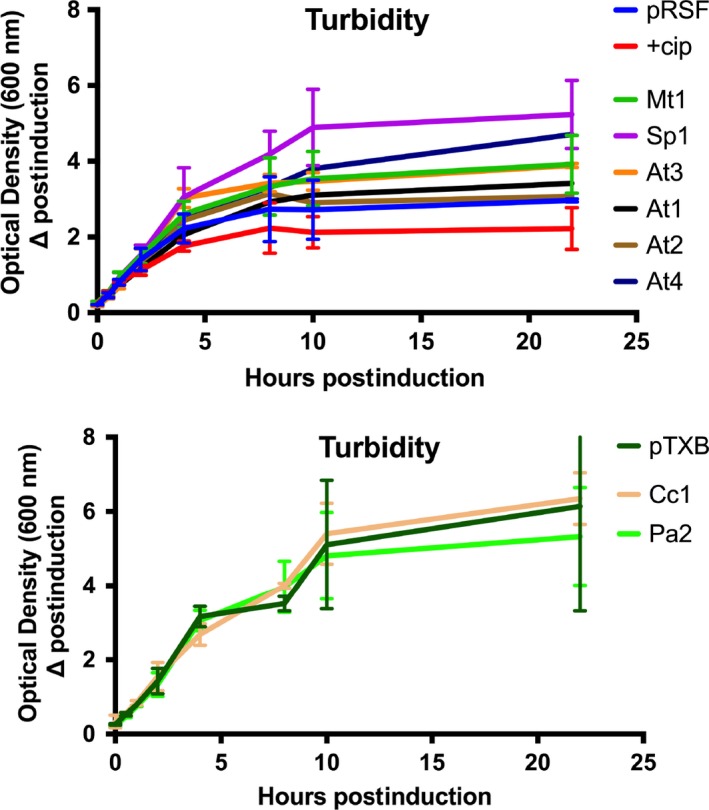
Toxin-antitoxin (TA) systems are found on both chromosomes and plasmids. These systems are unique in that they can confer both fatal and protective effects on bacterial cells-a quality that could potentially be harnessed given further understanding of these TA mechanisms. The current work focuses on the ParE subfamily, which is found throughout proteobacteria and has a sequence identity on average of approximately 12% (similarity at 30%-80%). Our aim is to evaluate the equivalency of chromosomally derived ParE toxin activity depending on its bacterial species of origin. Nine ParE toxins were analyzed, originating from six different bacterial species. Based on the resulting toxicity, three categories can be established: ParE toxins that do not exert toxicity under the experimental conditions, toxins that exert toxicity within the first four hours, and those that exert toxicity only after 10-12 hr of exposure. All tested ParE toxins produce a cellular morphologic change from rods to filaments, consistent with disruption of DNA topology. Analysis of the distribution of filamented cells within a population reveals a correlation between the extent of filamentation and toxicity. No membrane septation is visible along the length of the cell filaments, whereas aberrant lipid blebs are evident. Potent ParE-mediated toxicity is also correlated with a hallmark signature of abortive DNA replication, consistent with the inhibition of DNA gyrase.

Keywords: DNA gyrase; DNA topology; ParE toxin; filamented morphology; toxin-antitoxin systems.


Conflict of interest statement

None declared.

Figures

Figure 1
Figure 1
ParE toxins have conserved secondary structure elements within low sequence identity and similarity. (a) Sequences are aligned based on predicted secondary structure, except for the Cc1 which has an available three‐dimensional structure (3KXE, denoted by an *); abbreviations as in Table 1. Residue classes conserved at 65% or greater are boxed in blue, with conserved residues in red text. (b) Percent identity and similarity are shaded by most conserved (green) to least conserved (red). Toxins At2, At3, Vc1, and Mt1 (boxed) are found to exert the strongest toxicity (see Figure 2c)
Figure 2
Figure 2
Overexpression of ParE toxins yields variable toxicity to Escherichia coli cells. The colony‐forming units (CFUs) were counted at the indicated time points after induction of ParE toxins. Toxin abbreviations are as in Table 1. (a) Control samples are comprised of the parent vectors (pRSF, pTXB, p28GST) with no inserted toxin genes and with treatment of anti‐gyrase ciprofloxacin (CIP) antibiotic. (b) ParE toxins that do not induce toxicity, (c) ParE toxins that do induce toxicity, and (d) ParE toxins that induce delayed toxicity. Each measurement with standard deviation represents at least three biological replicates, typically measured in duplicate
Figure 3
Figure 3
Effect of ParE expression on cell morphology: control samples. Aliquots of cultures were subjected to examination at 4 hr postinduction (images, a, b, scale bar is equal to 1.5 μm) and at 15 hr postinduction. The distribution of cell lengths was measured and is presented in (c). Cells were stained using both DAPI (specific for DNA) and Nile Red (fluorescent in hydrophobic environments, e.g., lipidic membranes) in (a), and with a Live/Dead combination in (b). For the Live/Dead staining in (b), both dyes are DNA intercalators, and while the green fluorophore is membrane‐permeable, the red fluorophore can only stain intercellular contents when the membrane has been damaged. For the vector controls without a ParE gene inserted, cells appear healthy and normal both in morphology and in the distribution of lengths. However, treatment with anti‐gyrase antibacterial ciprofloxacin induces a filamented morphology and multiple foci of intracellular DNA material. Further, accumulation of lipidic material is found along the cell rather than only at the poles when DNA gyrase is inhibited
Figure 4
Figure 4
Effect of ParE expression on cell morphology: ParE toxins with no apparent impact on cell survival yet still mediate a filamented morphology. Aliquots of cultures were subjected to examination at 4 hr postinduction (images, a, b, scale bar is equal to 1.5 μm) and at 15 hr postinduction. The distribution of cell lengths was measured and is presented in (c). Cells were stained using both DAPI (specific for DNA) and Nile Red (fluorescent in hydrophobic environments, e.g., lipidic membranes) in (a), and with a Live/Dead combination in (b). For the Live/Dead staining in (b), both dyes are DNA intercalators, and while the green fluorophore is membrane‐permeable, the red fluorophore can only stain intercellular contents when the membrane has been damaged. Such membrane damage or mis‐regulation is apparent by punctate staining along the cells in (a) and by the entry of the red fluor in (b). Further, the cell morphology changes to a filamented distribution despite no impact on the CFU/ml measurements (see Figure 2)
Figure 5
Figure 5
Effect of ParE expression on cell morphology: ParE toxins that mediate a loss in cell viability. Aliquots of cultures were subjected to examination at 4 hr postinduction (images, a, b, scale bar is equal to 1.5 μm) and at 15 hr postinduction. The distribution of cell lengths was measured and is presented in (c). Cells were stained using both DAPI (specific for DNA) and Nile Red (fluorescent in hydrophobic environments, e.g., lipidic membranes) in (a), and with a Live/Dead combination in (b). For the Live/Dead staining in (b), both dyes are DNA intercalators, and while the green fluorophore is membrane‐permeable, the red fluorophore can only stain intercellular contents when the membrane has been damaged. Such membrane damage or mis‐regulation is apparent by punctate staining along the cells in (a) and by the entry of the red fluor in (b). Further, nucleic acid is clearly stained in (b), although not along the entire cell, indicating membrane damage in concert with aberrant DNA replication. The extent of filamentation is greatest with the At2 and Mt1 toxins, which also mediated the most dramatic drop in CFU/ml (see Figure 2)
Figure 6
Figure 6
Effect of ParE expression on cell morphology: ParE toxins with a delayed impact on cell survival. Aliquots of cultures were subjected to examination at 4 hr postinduction (images, a, b, scale bar is equal to 1.5 μm) and at 15 hr postinduction. The distribution of cell lengths was measured and is presented in (c). Cells were stained using both DAPI (specific for DNA) and Nile Red (fluorescent in hydrophobic environments, e.g., lipidic membranes) in (a), and with a Live/Dead combination in (b). For the Live/Dead staining in (b), both dyes are DNA intercalators, and while the green fluorophore is membrane‐permeable, the red fluorophore can only stain intercellular contents when the membrane has been damaged. Such membrane damage or mis‐regulation is apparent by punctate staining along the cells in (a) and by the entry of the red fluor in (b)
Figure 7
Figure 7
ParE toxin‐mediated inhibition of DNA gyrase results in increased abortive DNA replication, as evidenced by an increased copy number of the oriC sequence relative to the remaining chromosomal sequences. The Mt1 toxin has a prominent increase in the copy number of oriC, while toxins Sp1 and At3 and treatment with CIP produce a more modest yet appreciable increase above the pRSF vector only control. Abbreviations of toxin samples are as given in Table 1. Illumina MiSeq technology was used to sequence the genomes of samples after 4 hr of induction. Essentially, no mutations were noted as a result of toxin exposure, while the CIP‐exposed cells had extensively fragmented genomes (data not shown). The copy number of each read was analyzed to assess progress through DNA replication
Figure A1
Figure A1
Overexpression of ParE toxins does not produce significant decreases in culture turbidity. Measurements were conducted on at least three biological replicates and are presented as the log of the mean and standard deviation. Upper panel is constructs in the pRSF vector, while lower panel is constructs in the pTXB vector. Turbidity of the modified pET28a vector containing an inserted GST tag was equivalent to the pRSF vector with no insert
Figure A2
Figure A2
Protein expression levels of ParE toxins vary independent of affinity tag or construct. Cultures were grown in matched LB broth, and (check) total units of optical density were loaded per well. Tris–tricine gels (12%), top panels, were run in duplicate, and the second gel was transferred to nitrocellulose and probed with anti‐chitin (in a) or anti‐His (in b) antibodies, lower panels, to detect protein expression levels. Yellow arrowheads indicate expression of the ParE toxins. The right‐most lane on each gel in (b) was loaded with 5 μg of a His‐tagged control protein to facilitate comparisons. Images are representative from at least three independent biological replicates

Similar articles

Cited by

References

    1. Anantharaman, V. , & Aravind, L. New connections in the prokaryotic toxin‐antitoxin network: Relationship with the eukaryotic nonsense‐mediated RNA decay system. Genome Biology 2003, 4(12):R81–R81.15. - PMC - PubMed
    1. Andersen, S. B. , Ghoul, M. , Griffin, A. S. , Petersen, B. , Johansen, H. K. , & Molin, S. (2017). Diversity, prevalence, and longitudinal occurrence of type II toxin‐antitoxin systems of Pseudomonas aeruginosa infecting cystic fibrosis lungs. Frontiers in Microbiology, 8, 1180 10.3389/fmicb.2017.01180 - DOI - PMC - PubMed
    1. Biasini, M. , Bienert, S. , Waterhouse, A. , Arnold, K. , Studer, G. , Schmidt, T. , … Schwede, T. (2014). SWISS‐MODEL: Modelling protein tertiary and quaternary structure using evolutionary information. Nucleic Acids Research, 42(Web Server issue), W252–W258. 10.1093/nar/gku340 - DOI - PMC - PubMed
    1. Blower, T. R. , Salmond, G. P. , & Luisi, B. F. (2011). Balancing at survival's edge: The structure and adaptive benefits of prokaryotic toxin‐antitoxin partners. Current Opinion in Structural Biology, 21(1), 109–118. 10.1016/j.sbi.2010.10.009 - DOI - PubMed
    1. Bos, J. , Zhang, Q. , Vyawahare, S. , Rogers, E. , Rosenberg, S. M. , & Austin, R. H. (2015). Emergence of antibiotic resistance from multinucleated bacterial filaments. Proceedings of the National Academy of Sciences of the United States of America, 112(1), 178–183. 10.1073/pnas.1420702111 - DOI - PMC - PubMed

Publication types

LinkOut - more resources