

Decreased risk of HIV-associated TB during antiretroviral therapy expansion in rural Eswatini from 2009 to 2016: a cohort and population-based analysis
- PMID: 31310029
- PMCID: PMC6852273
- DOI: 10.1111/tmi.13290
Decreased risk of HIV-associated TB during antiretroviral therapy expansion in rural Eswatini from 2009 to 2016: a cohort and population-based analysis
Abstract
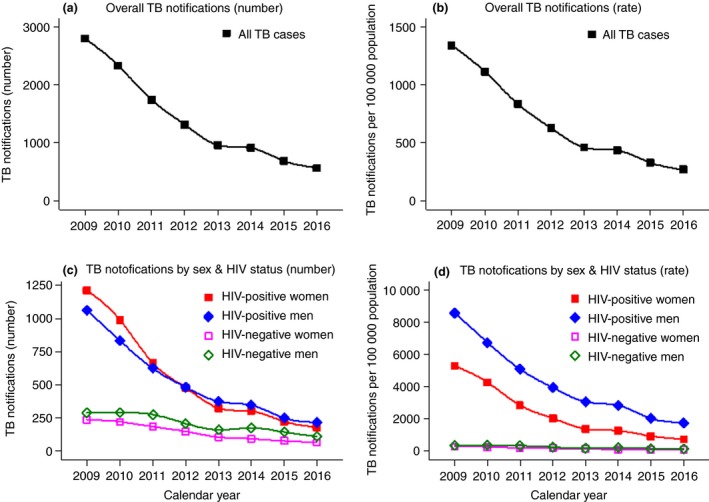
Objectives: This paper assesses patient- and population-level trends in TB notifications during rapid expansion of antiretroviral therapy in Eswatini which has an extremely high incidence of both TB and HIV.
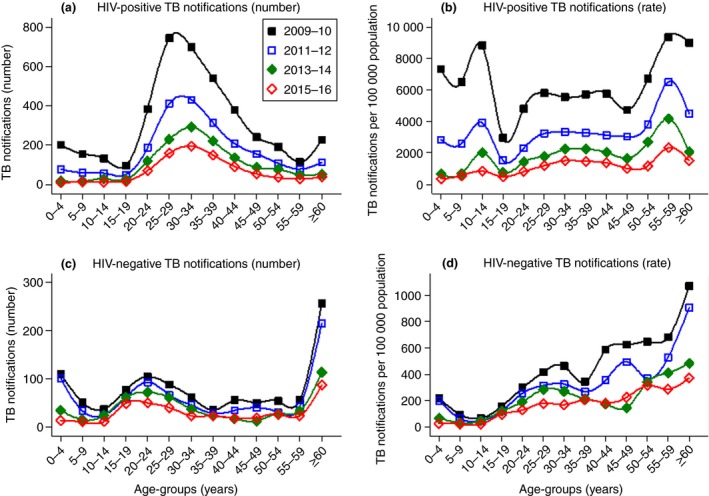
Methods: Patient- and population-level predictors and rates of HIV-associated TB were examined in the Shiselweni region in Eswatini from 2009 to 2016. Annual population-level denominators obtained from projected census data and prevalence estimates obtained from population-based surveys were combined with individual-level TB treatment data. Patient- and population-level predictors of HIV-associated TB were assessed with multivariate logistic and multivariate negative binomial regression models.
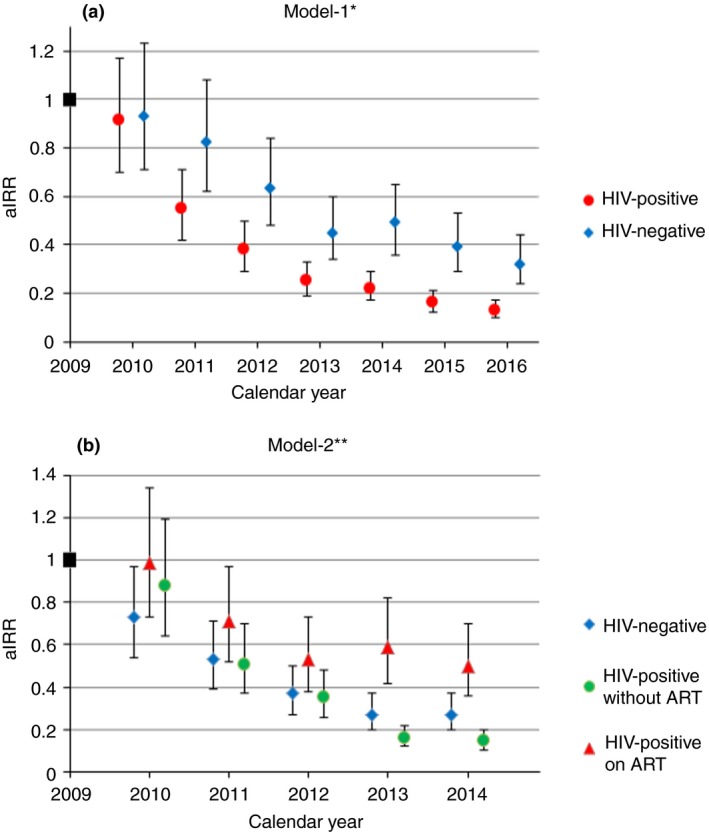
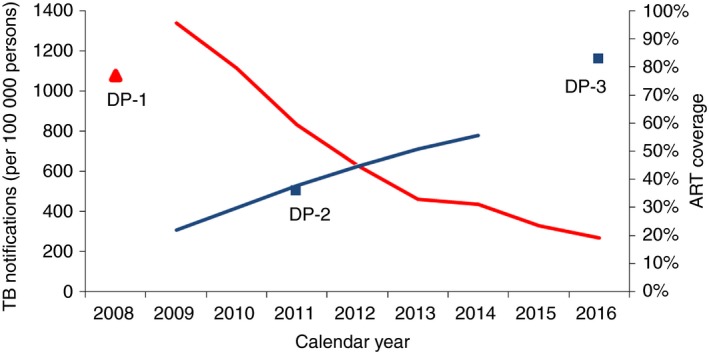
Results: Of 11 328 TB cases, 71.4% were HIV co-infected and 51.8% were women. TB notifications decreased fivefold between 2009 and 2016, from 1341 to 269 cases per 100 000 person-years. The decline was sixfold in PLHIV vs. threefold in the HIV-negative population. Main patient-level predictors of HIV-associated TB were recurrent TB treatment (adjusted odds ratio [aOR] 1.40, 95% confidence interval [CI]: 1.19-1.65), negative (aOR 1.31, 1.15-1.49) and missing (aOR 1.30, 1.11-1.53) bacteriological status and diagnosis at secondary healthcare level (aOR 1.18, 1.06-1.33). Compared with 2009, the probability of TB decreased for all years from 2011 (aOR 0.69, 0.58-0.83) to 2016 (aOR 0.54, 0.43-0.69). The most pronounced population-level predictor of TB was HIV-positive status (adjusted incidence risk ratio 19.47, 14.89-25.46).
Conclusions: This high HIV-TB prevalence setting experienced a rapid decline in TB notifications, most pronounced in PLHIV. Achievements in HIV-TB programming were likely contributing factors.
Objectifs: Ce document évalue les tendances des notifications de la tuberculose (TB) à l’échelle des patients et de la population lors de l'expansion rapide du traitement antirétroviral à Eswatini, où l'incidence de la TB et du VIH est extrêmement élevée. MÉTHODES: Les prédicteurs et les taux de TB associée au VIH à l’échelle des patients et de la population ont été examinés dans la région de Shiselweni à Eswatini de 2009 à 2016. Les dénominateurs annuels à l’échelle de la population obtenus à partir des données de recensement projetées et des estimations de la prévalence obtenues à partir d'enquêtes de population ont été combinés avec des données de traitement de la TB à l’échelle individuel. Les prédicteurs de la TB associée au VIH à l’échelle du patient et de la population ont été évalués à l'aide de modèles de régression logistique multivariée et binomiale négative multivariée. RÉSULTATS: Sur 11.328 cas de TB, 71,4% étaient coinfectés par le VIH et 51,8% étaient des femmes. Les notifications de TB ont été réduites de 5,0 fois entre 2009 et 2016, passant de 1.341 à 269 cas par 100.000 personnes-années. Le déclin était de 6,0 fois chez les PVVIH contre 3,0 fois dans la population négative pour le VIH. Les principaux prédicteurs de la TB associée au VIH à l’échelle des patients étaient les traitements antituberculeux récurrents (rapport de cotes ajusté [aOR] 1,40; intervalle de confiance à 95% [IC]: 1,19 à 1,65), un statut bactériologique négatif (aOR: 1,31; 1,15 à 1,49) et manquant (aOR: 1,30; 1,11 à 1,53) et le diagnostic au niveau des soins de santé secondaires (AOR 1,18; 1,06 à 1,33). Par rapport à 2009, la probabilité de contracter la TB a diminué pour toutes les années, de 2011 (aOR: 0,69; 0,58 à 0,83) à 2016 (aOR: 0,5; 0,43 à 0,69). Le prédicteur le plus prononcé de la TB à l’échelle de la population était le statut VIH-positif (rapport de risque d'incidence ajusté: 19,47; 14,89 à 25,46).
Conclusions: Ce contexte de prévalence élevée de la TB-VIH a connu un déclin rapide du nombre de notifications de TB, plus prononcé chez les PVVIH. Les réalisations dans la programmation VIH-TB étaient probablement des facteurs contributifs.
Keywords: ART expansion; Swaziland; expansion de l’ART; temporal trends; tendances temporelles; tuberculose; tuberculosis.
© 2019 The Authors. Tropical Medicine & International Health Published by John Wiley & Sons Ltd.
Figures
References
-
- Lawn SD, Bekker L‐G, Middelkoop K, Myer L, Wood R. Impact of HIV infection on the epidemiology of tuberculosis in a peri‐urban community in South Africa: the need for age‐specific interventions. Clin Infect Dis. 2006: 42: 1040–1047. - PubMed
-
- UNAIDS . UNAIDS data 2017. Joint United Nations Programme on HIV/AIDS (UNAIDS): Geneva, Switzerland; 2017. - PubMed
-
- WHO . Global Tuberculosis Report. World Health Organization: Geneva, Switzerland, 2017.
MeSH terms
Substances
LinkOut - more resources
Full Text Sources
Medical
