. 2019 Jul 31;141(30):11984-11996.
doi: 10.1021/jacs.9b04474. Epub 2019 Jul 16.

High-Resolution ENDOR Spectroscopy Combined with Quantum Chemical Calculations Reveals the Structure of Nitrogenase Janus Intermediate E4(4H)

Affiliations

High-Resolution ENDOR Spectroscopy Combined with Quantum Chemical Calculations Reveals the Structure of Nitrogenase Janus Intermediate E4(4H)

Veronika Hoeke et al. J Am Chem Soc. .

Erratum in

Abstract

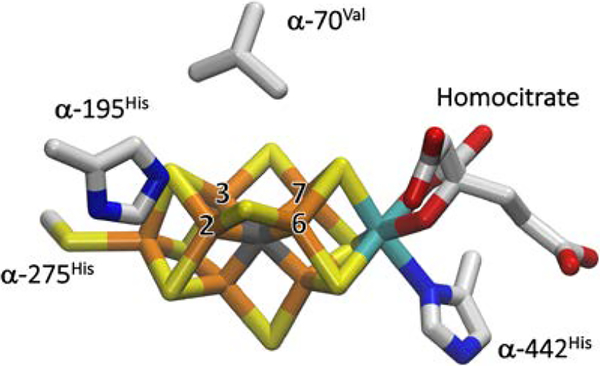
We have shown that the key state in N2 reduction to two NH3 molecules by the enzyme nitrogenase is E4(4H), the "Janus" intermediate, which has accumulated four [e-/H+] and is poised to undergo reductive elimination of H2 coupled to N2 binding and activation. Initial 1H and 95Mo ENDOR studies of freeze-trapped E4(4H) revealed that the catalytic multimetallic cluster (FeMo-co) binds two Fe-bridging hydrides, [Fe-H-Fe]. However, the analysis failed to provide a satisfactory picture of the relative spatial relationships of the two [Fe-H-Fe]. Our recent density functional theory (DFT) study yielded a lowest-energy form, denoted as E4(4H)(a), with two parallel Fe-H-Fe planes bridging pairs of "anchor" Fe on the Fe2,3,6,7 face of FeMo-co. However, the relative energies of structures E4(4H)(b), with one bridging and one terminal hydride, and E4(4H)(c), with one pair of anchor Fe supporting two bridging hydrides, were not beyond the uncertainties in the calculation. Moreover, a structure of V-dependent nitrogenase resulted in a proposed structure analogous to E4(4H)(c), and additional structures have been proposed in the DFT studies of others. To resolve the nature of hydride binding to the Janus intermediate, we performed exhaustive, high-resolution CW-stochastic 1H-ENDOR experiments using improved instrumentation, Mims 2H ENDOR, and a recently developed pulsed-ENDOR protocol ("PESTRE") to obtain absolute hyperfine interaction signs. These measurements are coupled to DFT structural models through an analytical point-dipole Hamiltonian for the hydride electron-nuclear dipolar coupling to its "anchoring" Fe ions, an approach that overcomes limitations inherent in both experimental interpretation and computational accuracy. The result is the freeze-trapped, lowest-energy Janus intermediate structure, E4(4H)(a).


Figures

Figure 1.
Figure 1.
Crystal structure of FeMo-co. Fe is show in rust, Mo in cyan, S in yellow, carbide in dark grey, carbon in light gray, N in blue and O in red. The Fe atoms of catalytic 4Fe-4S face are labelled as 2, 3, 6, and 7. The α−275Cys and α−442His FeMo-co ligands along with two amino acids, α−70Val and α−195His, that approach the FeMo-co are also shown. The image was created using PDB coordinate 2AFI.
Figure 2.
Figure 2.
Simplified kinetic scheme for nitrogen reduction that focuses on the electron-accumulation and FeMo-co activation stages. En notation: n = number of [e/H+] added to resting-state FeMo-co; in parentheses, stoichiometry of H/N bound to FeMo-co.
Fig. 3:
Fig. 3:
Lowest-energy structures of the Janus intermediate as seen in recent density functional theory computations E4(4H)(a,b,c), plus a high-energy structure with singly protonated carbide that has been proposed based on other computations, E4(3H;CH) and the P-7 structure proposed by Siegbahn,, which results from the accumulation of 7 [e-/H+]. The relative electronic energies (ΔE in kJ/mol calculated at DFT/BP86 level) for E4(4H)(a,b,c) and E4(3H;CH) along with selected Fe-H distances (in Angstrom) from Ref. 13 are provided. Fe-H distances for P-7 from Ref. 17 are also given. Note that the Fe-H distances of a [Fe-H-Fe] are not typically equal. Irons are shown in rust, molybdenum in cyan, carbon in gray, sulfurs in yellow, protic hydrogens in green, and hydrides in red.
Fig. 4.
Fig. 4.
35 GHz 1H stochastic-field modulation detected (stochastic CW) ENDOR spectra of E4(4H) acquired at g = 1.991 and 1.964 (Black); simulations generated as described below (Red). The signal with ν0(1H) ± ~3MHz, with both positive and negative features, represents transient responses from weakly coupled, more distant protons. Experimental Conditions: Microwave frequency, 35.045 GHz; modulation amplitude, 2.7 G; microwave power, 1 μW; RF power, 10 W; temperature, 2 K; stochastic sequence (sample/delay/RF), 1/3/3 ms; the bandwidth of the RF excitation was broadened to 100 kHz.
Fig 5.
Fig 5.
A) Single-crystal-like ENDOR spectra collected at g1 and g3 (slight splittings in H1 peaks at g1 indicate the rigorously single-crystal limit has not been reached). The figure illustrates the two possible scenarios by which the hydride signals can evolve across the EPR envelope in a 2D field-frequency pattern of ENDOR spectra collected from g1 to g3. In the first scenario, the patterns of H1 and H2 do not ‘cross’ at intermediate fields, i.e. A(H1) > A(H2) at g1 and A(H1) > A(H2) at g3 (solid lines). In the second scenario, the patterns of H1 and H2 do ‘cross’ at intermediate fields, so that A(H1) > A(H2) at g1 but A(H1) < A(H2) at g3 (dashed lines). B) Alternative models for hydride binding to FeMo-co, where a 4Fe4S face is depicted as an oval. Both hydrides may be terminal (model denoted T/T) or bridging (B/B), or the intermediate may contain one terminal and one bridging hydride, denoted T/B or B/T depending on the assignment to H1 and H2 (compare part A of this Figure). For each of these four models, either of the two ‘crossing’ scenarios illustrated in A can obtain, leading to a total of 8 possible bases for the 2D field-frequency plot.
Fig. 6.
Fig. 6.
Full 35 GHz 1H stochastic CW field-frequency ENDOR pattern for E4(4H). Experimental data (black), and sum of simulations for 1H1 and 1H2 (red), normalized at each g value. Curves running across the 2D plot were added as a guide to the eye, connecting the outer edges of 1H1 (blue) and 1H2 (green) spectral features along the different g values. Simulation parameters (B/B model) are listed in Table 1. At selected g values, a complementary 1H field-swept CW or 2H Mims ENDOR spectrum (thinner line; 2H spectra were collected on D2O turnover samples and scaled to 1H frequencies by factor gN(1H)/gN(2H) = 6.5) is shown to illustrate the match of experiment and simulation in the low-frequency region; for further 2H measurements, Fig S12. Experimental Conditions: 1H stochastic CW ENDOR: same as in Fig. 4. 1H field-swept CW ENDOR: Microwave frequency, 35.036 GHz; modulation amplitude, 0.7 G; microwave power, 1 μW; RF power, 10 W; RF scan speed, 1 MHz/s; temperature, 2 K; the bandwidth of the RF excitation was broadened to 100 kHz. 2H Mims ENDOR: 34.890 GHz; π/2 = 50 ns; τ = 400 ns; tRF = 30 μs; repetition time, 50 ms; temperature, 2 K.
Fig. 7.
Fig. 7.
Absolute hyperfine sign determination for hydride H1 by PESTRE at g = 1.977. A) 35 GHz 1H stochastic CW (thicker black line) and Davies (thinner black line) ENDOR responses around the ν+ branch of the 1H1 doublet, and sum (red) and separate 1H1 (blue), 1H2 (green) simulations. Simulation parameters (B/B model) are listed in Table 1. B) 1H PESTRE trace collected from the ν+ branch of the 1H1 doublet. Experimental Conditions: A) 1H stochastic CW ENDOR: same as in Fig. 4. 1H Davies ENDOR: Microwave frequency, 34.776 GHz; π = 60 ns; τ = 450 ns; tRF = 35 μs; repetition time, 100 ms; tmix = 5 μs; temperature, 2 K. B) Same as in A (1H Davies) except for: repetition time, 200 ms; RF frequency, 65.5 MHz.
Fig. 8.
Fig. 8.
Absolute hyperfine sign determination for hydride H2 by PESTRE at g2 = 2.008. A) 35 GHz 1H stochastic CW (thicker black line) and Davies (thinner black line) ENDOR responses around the ν- (black arrow) and ν+ (purple arrow) branch of the 1H2 doublet, and sum (red) and separate 1H1 (blue), 1H2 (green) simulations. Simulation parameters (B/B model) are listed in Table 1. B) 1H PESTRE traces collected from the ν- (black) and ν+ (purple) branch of the 1H2 doublet. Experimental Conditions: A) 1H stochastic CW ENDOR: same as in Fig. 4. 1H Davies ENDOR: Microwave frequency, 34.757 GHz; π = 80 ns; τ = 600 ns; tRF = 35 μs; repetition time, 50 ms; tmix = 5 μs; temperature, 2 K. B) Same as in A (1H Davies) except for: repetition time, 150 ms; RF frequency, 41.1 (ν-) and 64.7 (ν+) MHz.
Fig. 9.
Fig. 9.
2K 35 GHz,2H Mims ENDOR spectra of H2O and D2O turnover samples at g2 = 2.008. Experimental data (black and purple), and sum of simulations for1,2H1 and,2H2 (red). Mims holes in the 2H intensitiy indicated as open triangles show the extent of the 2H+ intensity. Simulation parameters for hydrides (B/B model) are listed in Table 1 and were scaled by factor gN(2H)/gN(1H) = 6.5−1 for 2H spectra. Experimental Conditions: A) Same as in Fig. 6. B) same as A except, microwave frequency, 34.80–34.87 GHz; repetition time, 100 ms; temperature.
Fig 10:
Fig 10:
Reduced dipolar tensor components, ai = Ti/t1, calculated as a function of t2/t1 for a hydride bridge with R = 2.52Å, r1 = 1.65,, r2 = 1.69. The two a1 nulls give similar angles, γ.
Chart 1:
Chart 1:
1H Tensor Permutations
Chart 2
Chart 2
Chart 3
Chart 3
Chart 4
Chart 4
Chart 5
Chart 5
Chart 6
Chart 6

Similar articles

Cited by

References

    1. Burgess BK; Lowe DJ Mechanism of Molybdenum Nitrogenase. Chem Rev 1996, 96, 2983–3012. - PubMed
    1. Seefeldt LC; Hoffman BM; Dean DR Mechanism of Mo-Dependent Nitrogenase. Annu. Rev. Biochem 2009, 78, 701–722. - PMC - PubMed
    1. Thorneley RNF; Lowe DJ Kinetics and Mechanism of the Nitrogenase Enzyme System. Metal Ions in Biology 1985, 7, 221–284.
    1. Wilson PE; Nyborg AC; Watt GD Duplication and Extension of the Thorneley and Lowe Kinetic Model for Klebsiella Pneumoniae Nitrogenase Catalysis Using a Mathematica Software Platform. Biophysical Chemistry 2001, 91, 281–304. - PubMed
    1. Lukoyanov D; Barney BM; Dean DR; Seefeldt LC; Hoffman BM Connecting Nitrogenase Intermediates with the Kinetic Scheme for N2 Reduction by a Relaxation Protocol and Identification of the N2 Binding State. PNAS 2007, 104, 1451–1455. - PMC - PubMed

Publication types

MeSH terms