. 2019 Aug 15;123(32):7075-7086.
doi: 10.1021/acs.jpca.9b05388. Epub 2019 Aug 2.

Positional Distributions of the Tethered Modules in Nitric Oxide Synthase: Monte Carlo Calculations and Pulsed EPR Measurements

Affiliations

Positional Distributions of the Tethered Modules in Nitric Oxide Synthase: Monte Carlo Calculations and Pulsed EPR Measurements

Andrei V Astashkin et al. J Phys Chem A. .

Abstract

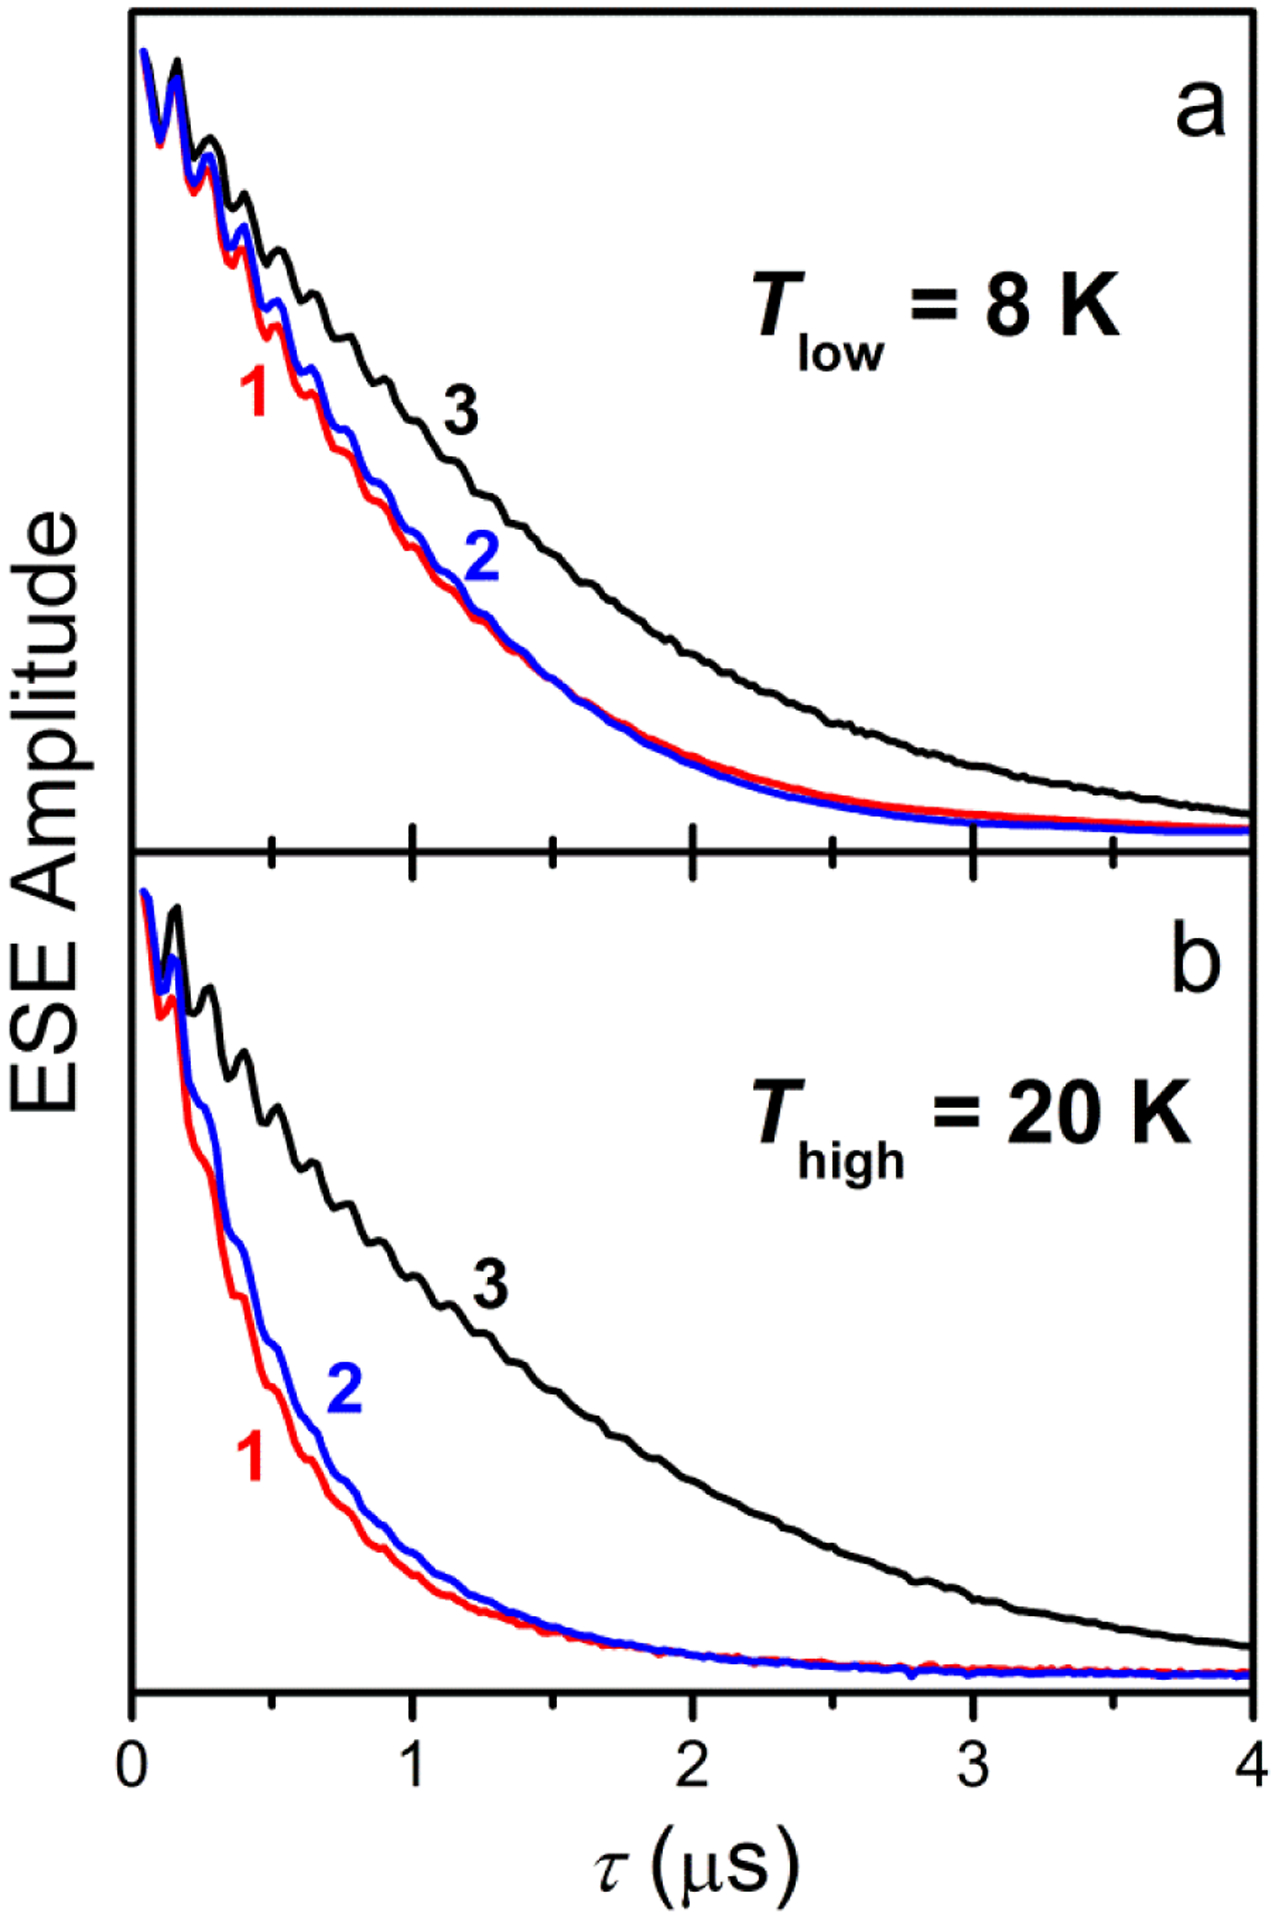
The nitric oxide synthase (NOS) enzyme consists of multiple domains connected by flexible random coil tethers. In a catalytic cycle, the NOS domains move within the limits determined by the length and flexibility of the interdomain tethers and form docking complexes with each other. This process represents a key component of the electron transport from the flavin adenine dinucleotide/reduced nicotinamide adenine dinucleotide phosphate binding domain to the catalytic heme centers located in the oxygenase domain. Studying the conformational behavior of NOS is therefore imperative for a full understanding of the overall catalytic mechanism. In this work, we have investigated the equilibrium positional distributions of the NOS domains and the bound calmodulin (CaM) by using Monte Carlo calculations of the NOS conformations. As a main experimental reference, we have used the magnetic dipole interaction between a bifunctional spin label attached to T34C/S38C mutant CaM and the NOS heme centers, which was measured by pulsed electron paramagnetic resonance. In general, the calculations of the conformational distributions allow one to determine the range and statistics of positions occupied by the tethered protein domains, assess the crowding effect of the multiple domains on each other, evaluate the accessibility of various potential domain docking sites, and estimate the interaction energies required to achieve target populations of the docked states. In the particular application described here, we have established the specific mechanisms by which the bound CaM facilitates the flavin mononucleotide (FMN)/heme interdomain docking in NOS. We have also shown that the intersubunit FMN/heme domain docking and electron transfer in the homodimeric NOS protein are dictated by the existing structural makeup of the protein. Finally, from comparison of the calculated and experimental docking probabilities, the characteristic stabilization energies for the CaM/heme domain and the FMN domain/heme domain docking complexes have been estimated as -4.5kT and -10.5kT, respectively.


Figures

Fig. 1.
Fig. 1.
The structural model used for calculating the conformational distribution of rat nNOS. The heme domain was represented by a crystal structure (pdb 4JSH), while all other structural elements (the amino acid residues of the tethers, CaM, and the FMN and FNR domains) were modeled by spheres with the radii indicated in the Figure. The amino acid sequence numbers of the tethers are indicated in red.
Fig. 2.
Fig. 2.
A chain fragment showing the definition of the propagation angles θ and φ.
Fig. 3.
Fig. 3.
The distance dependence of the interaction energy described by Eq. 2.
Fig. 4.
Fig. 4.
Calculated positional distributions of the centers of FNR domain (a, d), FMN domain (b, e), and bound CaM (c, f) in full-length nNOS. Panels a - c show the pseudouniform distributions calculated for all Ed values equal to zero. The distributions in panels d – f are calculated for Ed(CaM) = −4.5kT, Ed(FMN) = −10.5kT, Ed(FF) = 0, and Ro = 5 Å. The area around the distribution maxima is highlighted by the black color. The heme domain is shown in cyan. Brown circles indicate the positions of the heme centers. Blue circle shows the position of the tether origin. The yellow circle with a black border shows the predicted docking position of the module shown in the given panel.
Fig. 5.
Fig. 5.
Pd(CaM) and Pd(FMN) dependences on Ed(CaM) and Ed(FMN), respectively, calculated for nNOS oxyFMN construct using the Monte Carlo approach (circles) and Eq. 3 (dashed lines). Red circles, Pd(FMN) in the absence of CaM; blue filled circles, Pd(FMN) in the presence of bound CaM, but with Ed(CaM) = 0; blue open circles, Pd(FMN) in the presence of bound CaM, with Ed(CaM) = −12.5kT (corresponds to Pd(CaM) ~ 1); black filled circles, Pd(CaM) for Ed(FMN) = 0; black open circles, Pd(CaM) for Ed(FMN) = −17.5kT (corresponds to Pd(FMN) ~ 1). Dashed lines approximating the dependences given by circles are calculated using Eq. 3 with Eu = 0 and Vu/Vd = 160000 (for red circles), 105000 (blue filled circles), 19000 (blue open circles), 600 (black filled circles), and 270 (black open circles).
Fig. 6.
Fig. 6.
RIDME traces recorded for BSL CaM at Tlow = 8 K (panel a) and Thigh = 20 K (panel b). Traces 1, 2, and 3 in each panel correspond to nNOS oxyFMN with bound CaM, full-length nNOS with bound CaM, and full-length nNOS with unbound CaM, respectively. Experimental conditions: mw frequency, 34.612 GHz; mw pulses, 10, 10, 10, and 14 ns; TR = 65 μs; magnetic field, Bo = 1.2325 T (corresponds to the maximum of the SL field sweep spectrum), pulse repetition rate, 5 Hz.
Fig. 7.
Fig. 7.
Comparison of the experimental and calculated quotient RIDME traces for nNOS oxyFMN. Black line, the quotient RIDME trace obtained from the experimental nNOS oxyFMN data (traces 1 in Fig. 6) using Eq. 5. Blue line, RIDME trace calculated based on the pseudouniform conformational distribution. Red line, RIDME trace calculated based on the conformational distribution obtained using Ro = 5 Å, Ed(CaM) = −4.5kT, and Ed(FMN) = −10.5kT.
Fig. 8.
Fig. 8.
Results of calculations of nNOS conformations, which give reasonable fits of the quotient RIDME trace shown in Fig. 7. Panel a shows the pairs of Ed(FMN) and Ed(CaM) values; panels b and c show the corresponding Pd(CaM) and Pd(FMN) values, respectively. Black, red, and blue circles and lines correspond to Ro = 0 Å, 5 Å, and 10 Å, respectively. Horizontal yellow regions show the ranges of Pd(CaM) and Pd(FMN) values, which correspond to the (expected) experimental values. The gray vertical region corresponds to the range of situations when Pd(CaM) and Pd(FMN) calculated for Ro = 5 Å simultaneously agree with the experimental values.
Fig. 9.
Fig. 9.
Comparison of the experimental and calculated quotient RIDME traces for the full-length nNOS enzyme. Black line, the quotient RIDME trace obtained from the experimental data (traces 2 in Fig. 6) using Eq. 5. Gray line, the quotient RIDME trace of the oxyFMN construct reproduced from Fig. 7. Blue line, RIDME trace calculated based on the conformational distribution obtained using Ed(FF) = 0. Red line, RIDME trace calculated based on the conformational distribution obtained with Ed(FF) = −10.5kT. Other calculation parameters were the same as in the calculation for the oxyFMN construct: Ro = 5 Å, Ed(CaM) = −4.5kT, and Ed(FMN) = −10.5kT.

References

    1. Förstermann U; Sessa WC, Nitric Oxide Synthases: Regulation and Function. Eur Heart J 2012, 33, 829–837. - PMC - PubMed
    1. Astashkin AV; Chen L; Zhou X; Li H; Poulos TL; Liu KJ; Guillemette JG; Feng C, Pulsed Electron Paramagnetic Resonance Study of Domain Docking in Neuronal Nitric Oxide Synthase: The Calmodulin and Output State Perspective. J. Phys. Chem. A 2014, 118, 6864–6872. - PMC - PubMed
    1. Smith BC; Underbakke ES; Kulp DW; Schief WR; Marletta MA, Nitric Oxide Synthase Domain Interfaces Regulate Electron Transfer and Calmodulin Activation. Proc Natl Acad Sci U S A 2013, 110, E3577–E3586. - PMC - PubMed
    1. He Y; Haque MM; Stuehr DJ; Lu HP, Single-Molecule Spectroscopy Reveals How Calmodulin Activates No Synthase by Controlling Its Conformational Fluctuation Dynamics. Proc Natl Acad Sci U S A 2015, 112, 11835–11840. - PMC - PubMed
    1. Arnett DC; Persechini A; Tran Q-K; Black DJ; Johnson CK, Fluorescence Quenching Studies of Structure and Dynamics in Calmodulin–Enos Complexes. FEBS Lett. 2015, 589, 1173–1178. - PMC - PubMed

MeSH terms

Substances