Clinical Trial
. 2019 Jul 16;129(10):4305-4315.
doi: 10.1172/JCI128654.

The alveolar immune cell landscape is dysregulated in checkpoint inhibitor pneumonitis

Affiliations
Clinical Trial

The alveolar immune cell landscape is dysregulated in checkpoint inhibitor pneumonitis

Karthik Suresh et al. J Clin Invest. .

Abstract

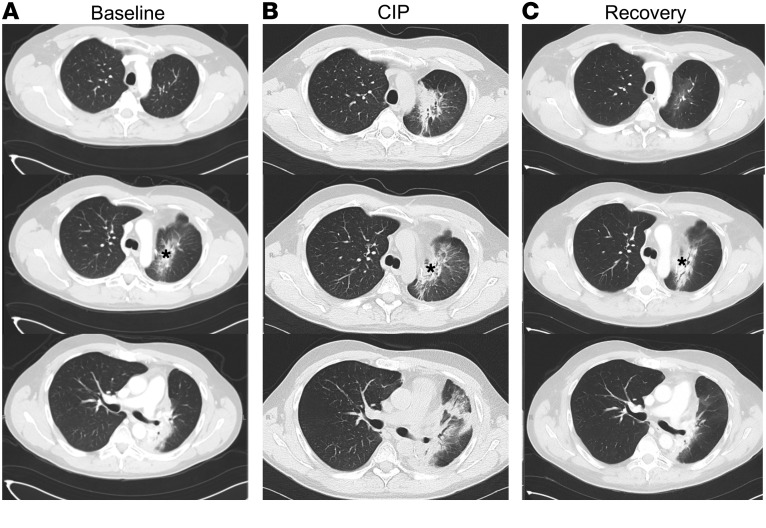
Background: Checkpoint inhibitor pneumonitis (CIP) is a highly morbid complication of immune checkpoint immunotherapy (ICI), one which precludes the continuation of ICI. Yet, the mechanistic underpinnings of CIP are unknown.

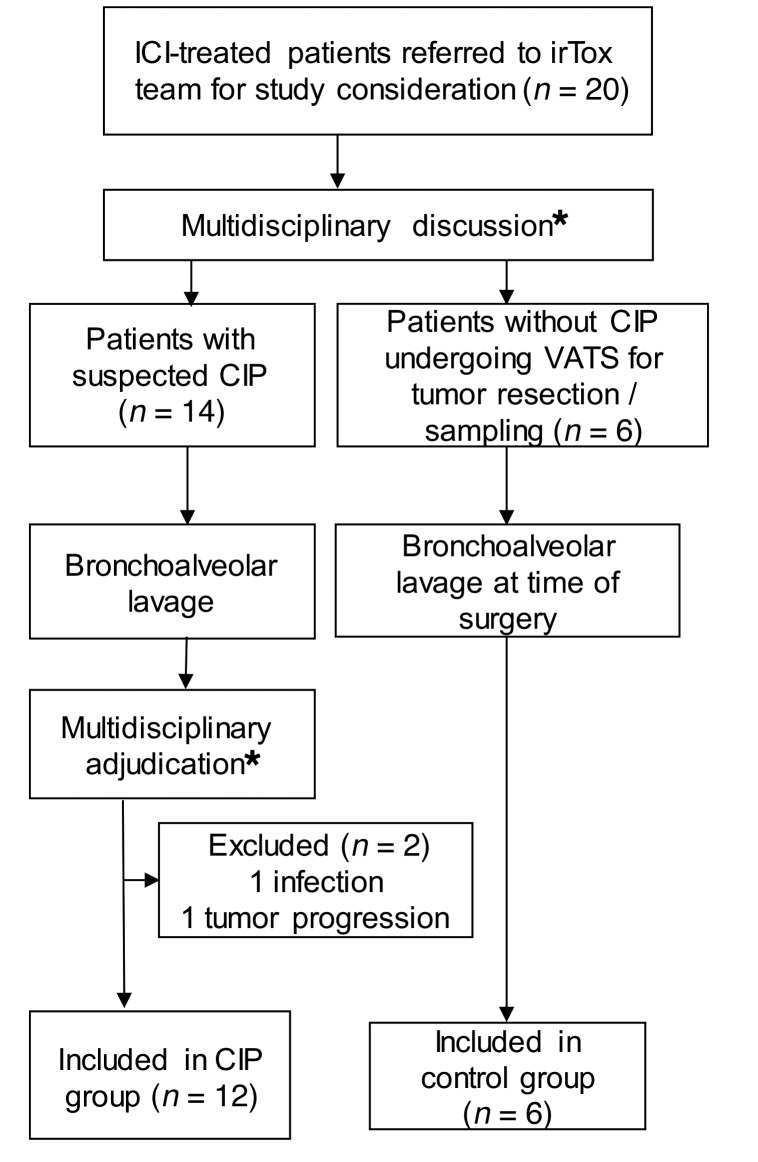
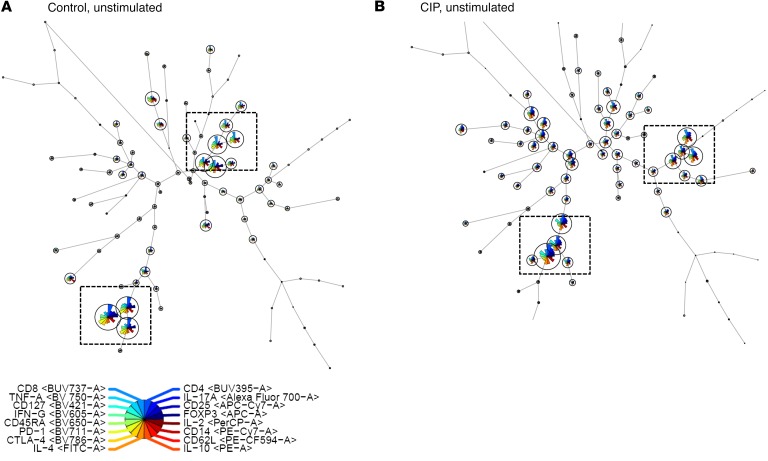
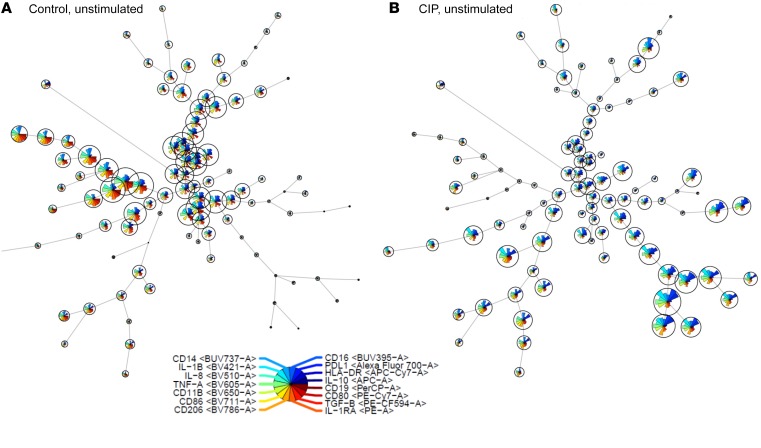
Methods: To better understand the mechanism of lung injury in CIP, we prospectively collected bronchoalveolar lavage (BAL) samples in ICI-treated patients with (n=12) and without CIP (n=6), prior to initiation of first-line therapy for CIP (high dose corticosteroids. We analyzed BAL immune cell populations using a combination of traditional multicolor flow cytometry gating, unsupervised clustering analysis and BAL supernatant cytokine measurements.

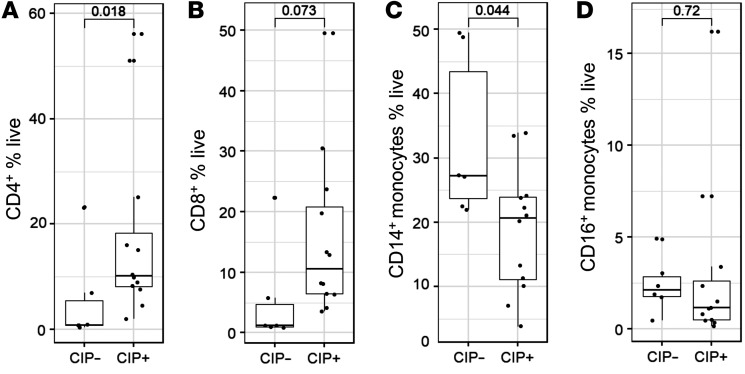
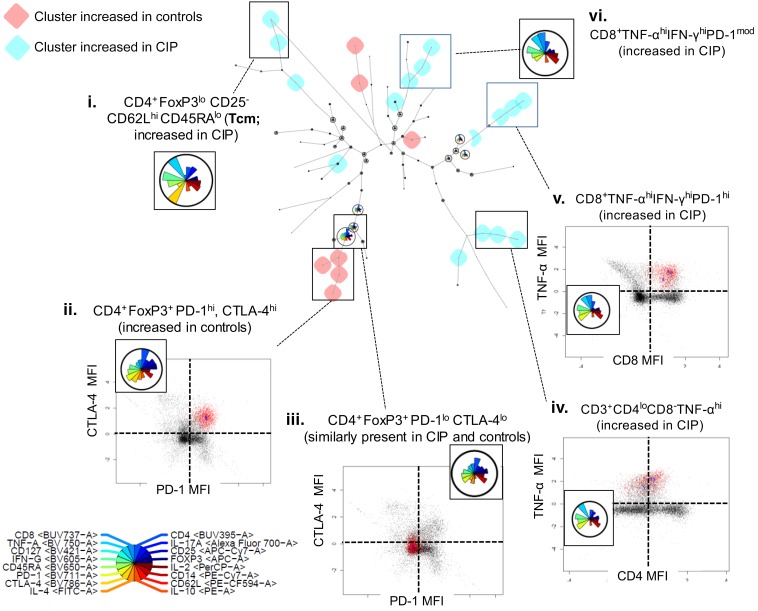
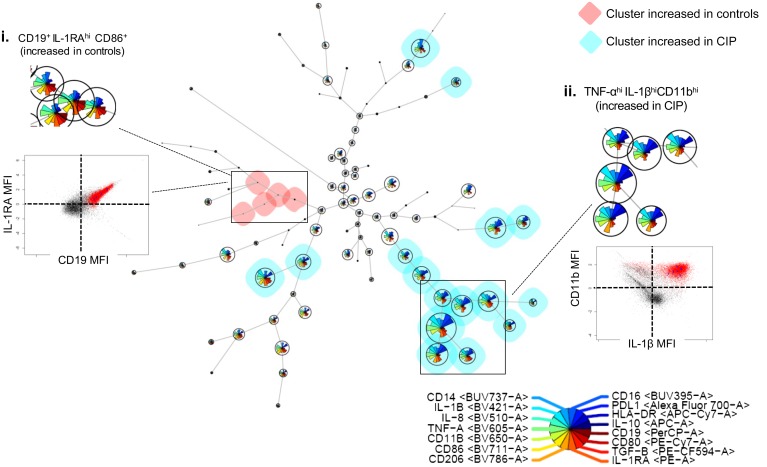
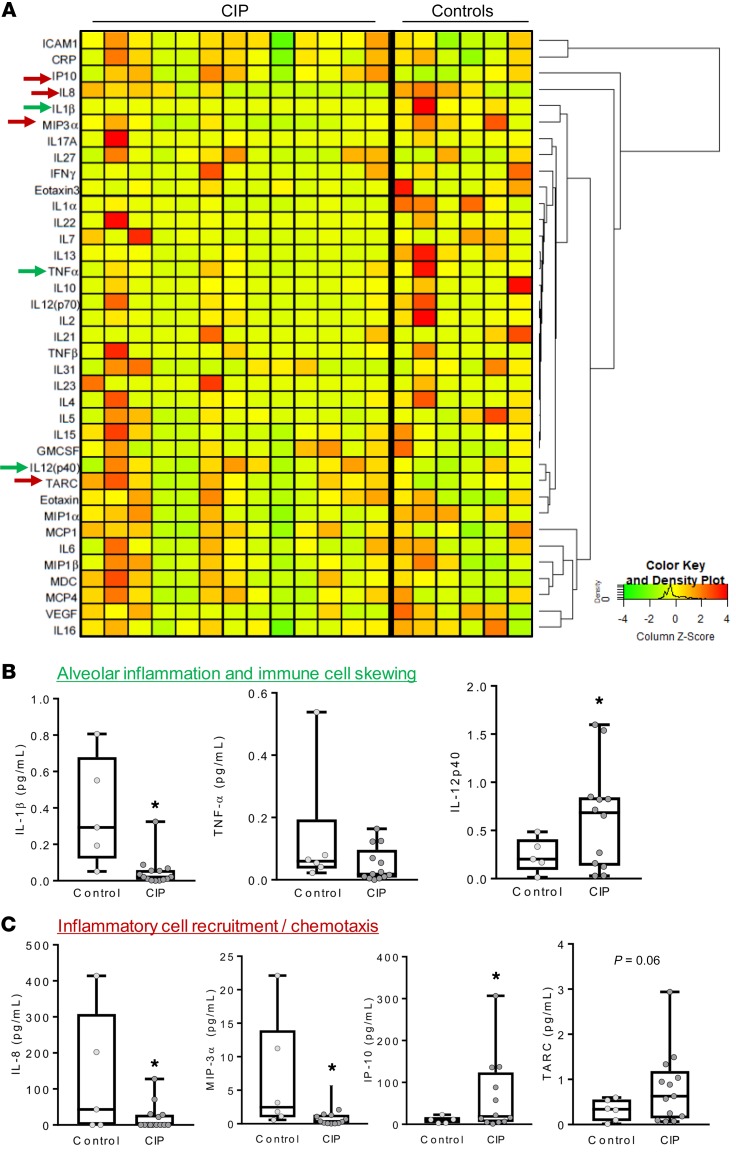
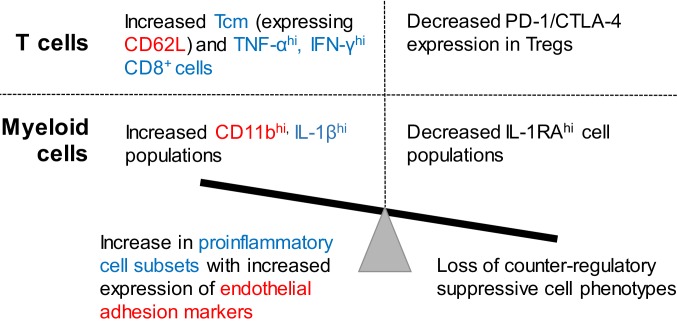
Results: We found increased BAL lymphocytosis, predominantly CD4+ T cells, in CIP. Specifically, we observed increased numbers of BAL central memory T-cells (Tcm), evidence of Type I polarization, and decreased expression of CTLA-4 and PD-1 in BAL Tregs, suggesting both activation of pro-inflammatory subsets and an attenuated suppressive phenotype. CIP BAL myeloid immune populations displayed enhanced expression of IL-1β and decreased expression of counter-regulatory IL-1RA. We observed increased levels of T cell chemoattractants in the BAL supernatant, consistent with our pro-inflammatory, lymphocytic cellular landscape.

Conclusion: We observe several immune cell subpopulations that are dysregulated in CIP, which may represent possible targets that could lead to therapeutics for this morbid immune related adverse event.

Keywords: Cancer immunotherapy; Immunology; Lung cancer; Pulmonology; Th1 response.


Conflict of interest statement

Conflict of interest: The authors have declared that no conflict of interest exists.

Figures

Figure 1
Figure 1. Radiographic presentation of CIP.
Representative computed tomography images of an ICI-treated NSCLC patient (A) prior to development of CIP, (B) at the time of CIP diagnosis, and (C) after 3 weeks of steroid treatment. *Denotes area of preexisting post-radiotherapy changes that were stable before initiation of ICI.
Figure 2
Figure 2. Study design and participating patients.
Consort diagram showing study enrollment and adjudication of patients into control and CIP groups. *Pertinent clinical, radiographic, laboratory and microbiologic (including BAL culture when available) data were reviewed by the immune-related toxicity (irTox) team before and (in cases of suspected CIP) after bronchoscopy. At both time points, patients with suspected CIP with an alternative etiology for symptoms were excluded from the CIP group (n = 2). ICI, immune checkpoint inhibitor; VATS, video-assisted thoracic surgery; CIP, checkpoint inhibitor pneumonitis.
Figure 3
Figure 3. BAL lymphocytosis in patients with CIP.
Scatter plots showing number of (A) CD4+, (B) CD8+, (C) CD14+, and (D) CD16+ T cells (A and B) and monocytes (C and D), respectively, in control and CIP samples. n = 6 (CIP–), 12 (CIP+). Comparisons between groups performed using Mann-Whitney test.
Figure 4
Figure 4. T cell populations in CIP.
Unsupervised clustering of T cells in BALF samples of patients without (control, n = 6) and with CIP (n = 12). Cluster maps showing distribution of T cell subpopulations in (A) unstimulated controls and (B) unstimulated CIP. Within each cluster map, larger cell populations distinct to that particular condition are highlighted (square boxes).
Figure 5
Figure 5. Abnormal T cell subsets in CIP.
Differential cluster map (center) shows clusters where the number of cells within the cluster were increased by 95% in controls (red, n = 6) or CIP (cyan, n = 12). Cytokine profile (inset) and scatter plot of relevant cytokines showing MFI in the selected clusters (red) compared with MFI across all clusters (black) in (counterclockwise): (i) CD4+FoxP3loCD25CD62LhiCD45RAlo cluster increased in CIP; (ii) PD-1hiCTLA-4hi clusters of Tregs increased in controls, scatter plot showing PD-1/CTLA-4 MFI in selected clusters; (iii) similar (i.e., <95% difference) expression of PD-1loCTLA-4lo Treg clusters in CIP and controls, scatter plot showing PD-1/CTLA-4 MFI in selected clusters; (iv) a CD3+CD4lo CD8TNF-αhi population increased in CIP, scatter plot showing CD4/TNF-α MFI in selected clusters; (v) CD8+TNF-αhiPD-1hi clusters increased in CIP, scatter plot showing CD8/TNF-α MFI in selected clusters; and (vi) a second set of CD8+TNF-αhi clusters increased in CIP.
Figure 6
Figure 6. Monocyte populations in CIP.
Unsupervised clustering of non–T cells (singlet, live, CD3) in BALF samples of patients without (control, n = 6) and with CIP (n = 12). Cluster maps showing distribution of myeloid subpopulations in (A) unstimulated controls and (B) unstimulated CIP.
Figure 7
Figure 7. Abnormal monocyte subsets in CIP.
Differential cluster map of myeloid cells showing clusters that are increased by at least 95% between unstimulated controls (n = 6) and unstimulated CIP (n = 12) samples. Cytokine profiles and scatter plot of relevant cytokines showing MFI in the selected clusters (red) compared with MFI across all clusters (black) showing: (i) population of IL-1RAhi B cells (CD19+) increased in controls and (ii) large population of related clusters of IL-10hiIL-1βhi myeloid cells (CD14loCD16loCD19) increased in CIP.
Figure 8
Figure 8. BALF cytokine analysis.
(A) Heatmap showing expression of various cytokines in control and CIP BAL supernatant samples. Cytokines are scaled, centered, and hierarchically clustered (using the Euclidean distance). (B) Box-and-whisker plots showing median, minimum, and maximum with individual data point overlay (dots) for select cytokines involved in alveolar inflammation and immune cell skewing (B) or inflammatory cell recruitment/chemotaxis (C). *Denotes significant difference from control BALF samples (Mann-Whitney, P < 0.05).
Figure 9
Figure 9. Summary of dysregulated immune cell phenotypes in CIP.

Comment in

References

    1. Lipson EJ, Forde PM, Hammers HJ, Emens LA, Taube JM, Topalian SL. Antagonists of PD-1 and PD-L1 in cancer treatment. Semin Oncol. 2015;42(4):587–600. doi: 10.1053/j.seminoncol.2015.05.013. - DOI - PMC - PubMed
    1. Brahmer J, et al. Nivolumab versus docetaxel in advanced squamous-cell non-small-cell lung cancer. N Engl J Med. 2015;373(2):123–135. doi: 10.1056/NEJMoa1504627. - DOI - PMC - PubMed
    1. Hellmann MD, et al. Nivolumab plus ipilimumab as first-line treatment for advanced non-small-cell lung cancer (CheckMate 012): results of an open-label, phase 1, multicohort study. Lancet Oncol. 2017;18(1):31–41. doi: 10.1016/S1470-2045(16)30624-6. - DOI - PMC - PubMed
    1. Balaji A, Verde F, Suresh K, Naidoo J. Pneumonitis from anti-PD-1/ PD-L1 therapy. Oncology (Williston Park, NY) 2017;31(10):739–746, 754. - PubMed
    1. Suresh K, Naidoo J, Lin CT, Danoff S. Immune checkpoint immunotherapy for non-small cell lung cancer: benefits and pulmonary toxicities. Chest. 2018;154(6):1416–1423. doi: 10.1016/j.chest.2018.08.1048. - DOI - PMC - PubMed

Publication types

MeSH terms