. 2019 Jul 16;5(15):e127736.
doi: 10.1172/jci.insight.127736.

Identification and therapeutic rescue of autophagosome and glutamate receptor defects in C9ORF72 and sporadic ALS neurons

Affiliations

Identification and therapeutic rescue of autophagosome and glutamate receptor defects in C9ORF72 and sporadic ALS neurons

Yingxiao Shi et al. JCI Insight. .

Abstract

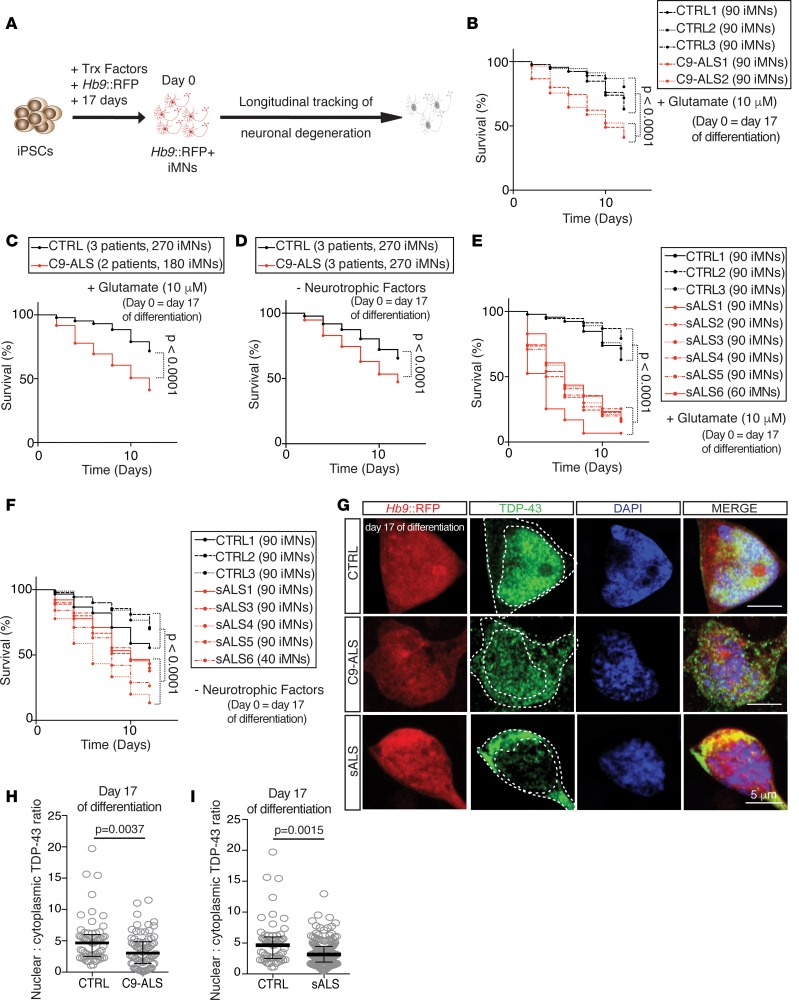
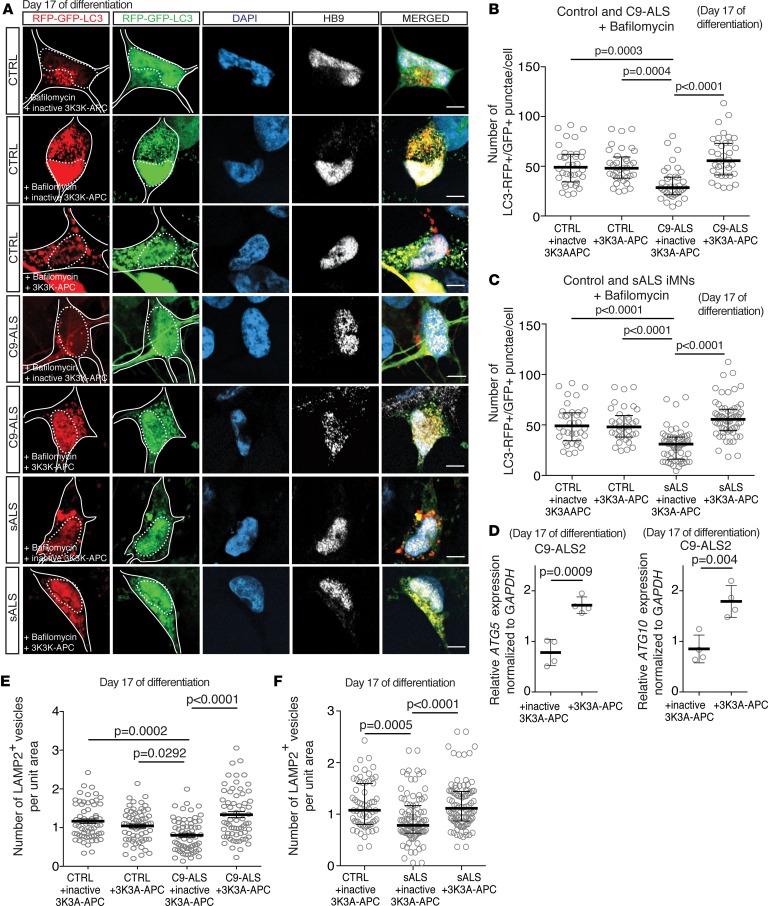
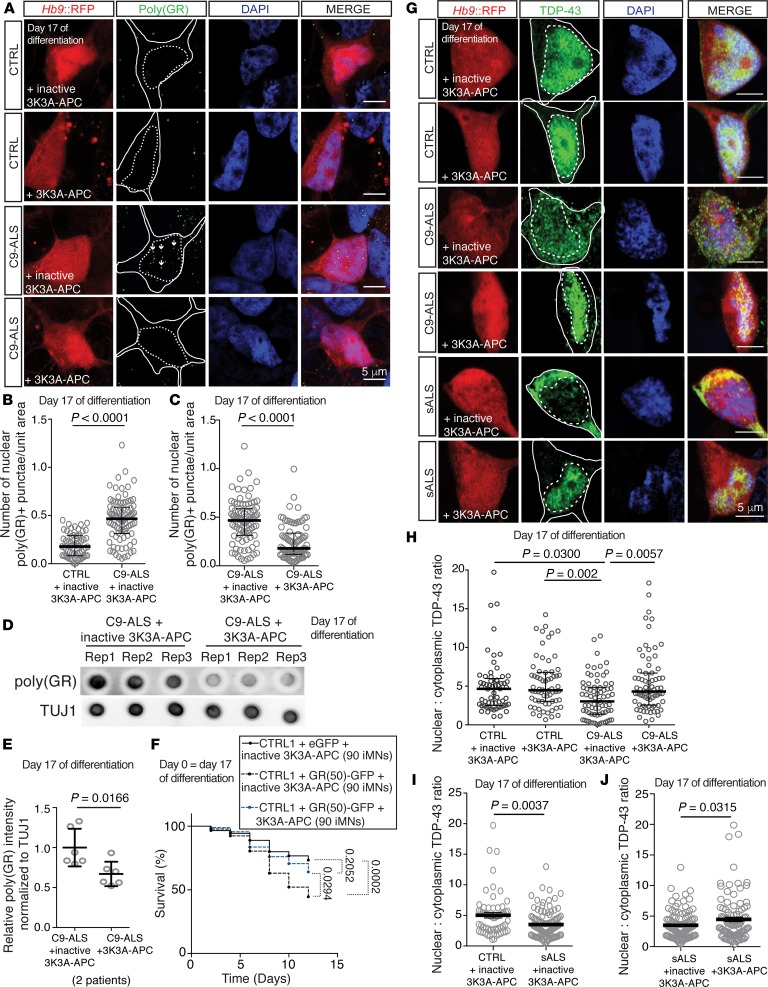
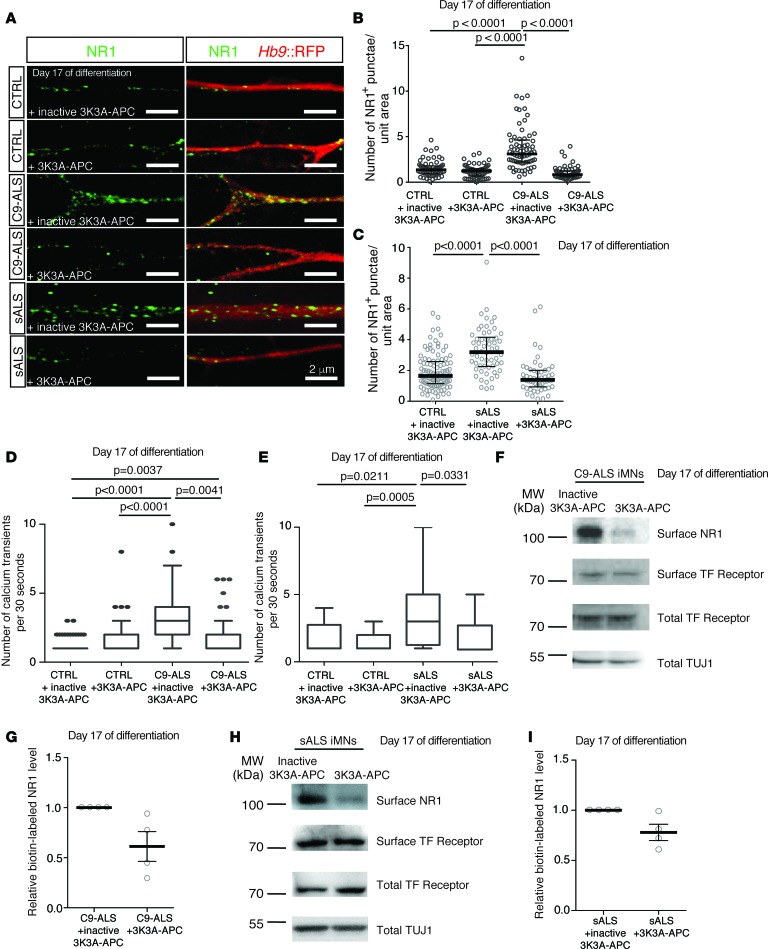
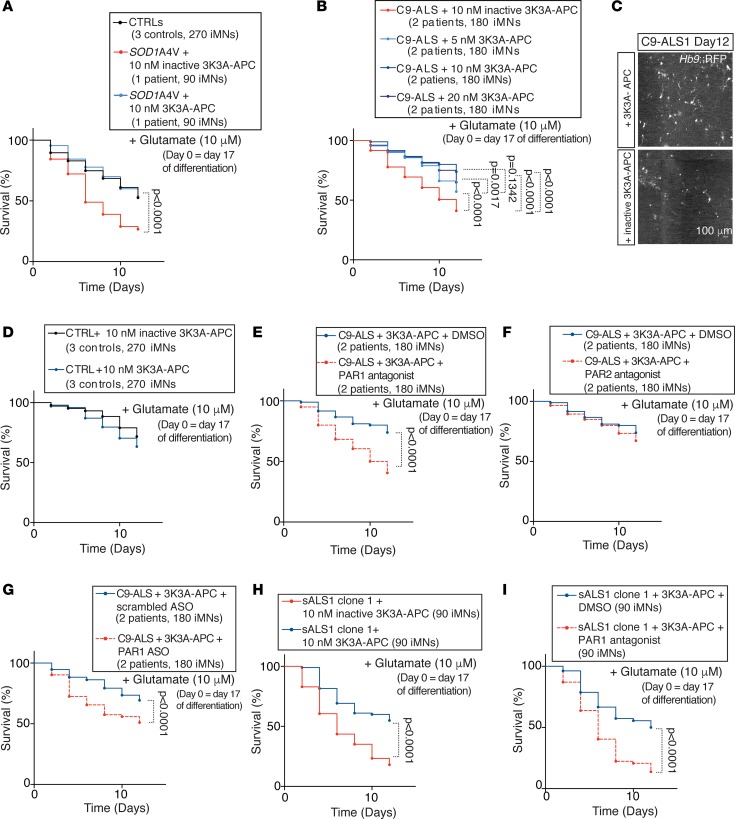
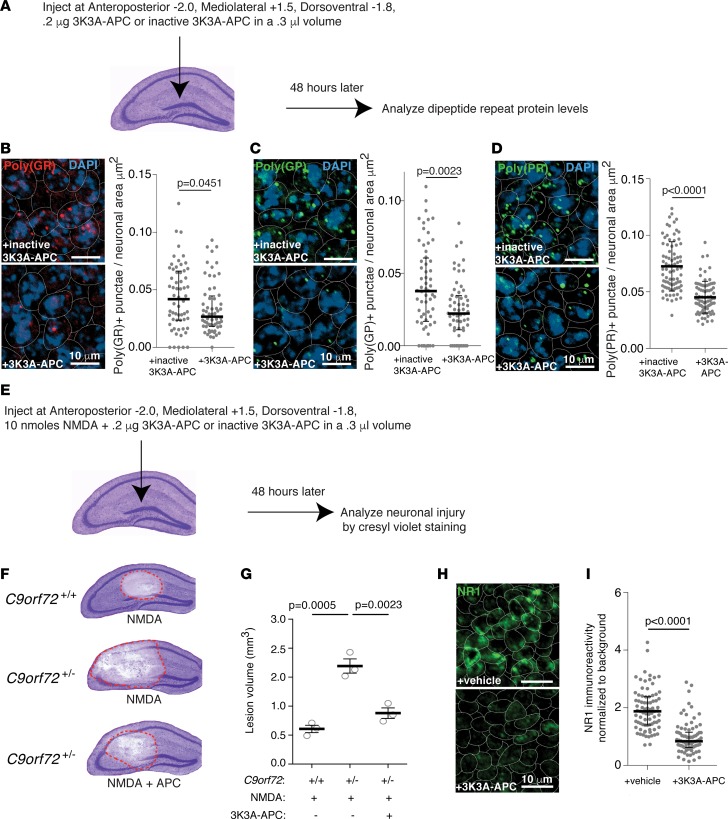
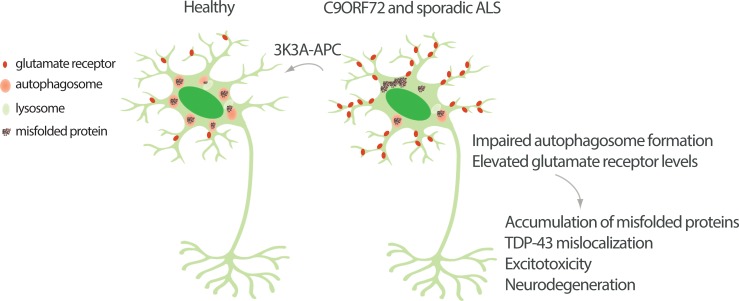
Amyotrophic lateral sclerosis (ALS) is a fatal motor neuron disease with diverse etiologies. Therefore, the identification of common disease mechanisms and therapeutics targeting these mechanisms could dramatically improve clinical outcomes. To this end, we developed induced motor neuron (iMN) models from C9ORF72 and sporadic ALS (sALS) patients to identify targets that are effective against these types of cases, which together comprise ~90% of patients. We find that iMNs from C9ORF72 and several sporadic ALS patients share two common defects - impaired autophagosome formation and the aberrant accumulation of glutamate receptors. Moreover, we show that an anticoagulation-deficient form of activated protein C, 3K3A-APC, rescues these defects in both C9ORF72 and sporadic ALS iMNs. As a result, 3K3A-APC treatment lowers C9ORF72 dipeptide repeat protein (DPR) levels, restores nuclear TDP-43 localization, and rescues the survival of both C9ORF72 and sporadic ALS iMNs. Importantly, 3K3A-APC also lowers glutamate receptor levels and rescues proteostasis in vivo in C9ORF72 gain- and loss-of-function mouse models. Thus, motor neurons from C9ORF72 and at least a subset of sporadic ALS patients share common, early defects in autophagosome formation and glutamate receptor homeostasis and a single therapeutic approach may be efficacious against these disease processes.

Keywords: ALS; Neurodegeneration; Neuroscience; Stem cells.


Conflict of interest statement

Conflict of interest: JKI is a co-founder of AcuraStem Incorporated. JKI declares that he is bound by confidentiality agreements that prevent him from disclosing details of his financial interests in this work. BVZ is a scientific founder and chairs the scientific advisory board of ZZ Biotech LLC, a biotechnology company with a mission to develop activated protein C and its functional mutants for the treatment of stroke and other neurological disorders.

Figures

Figure 1
Figure 1. Identification of neurodegenerative phenotypes in sporadic ALS patient iMNs.
(A) Production of Hb9::RFP+ iMNs and survival tracking by time-lapse microscopy. (B and C) Survival of control (CTRL) and C9ORF72 ALS patient (C9-ALS) iMNs with a 12-hour pulse treatment of excess glutamate shown for each individual line separately (B), or for iMNs from all lines in aggregate (C). For B and C, n = 90 iMNs per line for 3 control and 2 C9-ALS lines, iMNs quantified from 3 biologically independent iMN conversions per line. (D) Survival of control and C9ORF72 ALS patient iMNs after withdrawal of neurotrophic factor supplementation. iMNs from all control or C9ORF72 patient lines shown in aggregate. n = 90 iMNs per line for 3 control and 3 C9-ALS lines, iMNs quantified from 3 biologically independent iMN conversions per line. (E and F) Survival of control and sporadic ALS (sALS) patient lines after glutamate treatment (E) or withdrawal of neurotrophic factor supplementation (F). iMNs from all control or C9ORF72 patient lines shown in aggregate. n = 90 iMNs per line for 3 control and 6 (E) or 5 (F) sporadic ALS lines, except sALS6 which had 60 (E) or 40 (F) iMNs counted. iMNs quantified from 3 biologically independent iMN conversions per line. (GI) Immunofluorescence analysis of total TDP-43 (G) and quantification of the ratio of nuclear to cytoplasmic TDP-43 in control, C9-ALS (H), or sporadic ALS (I) iMNs. Ratio of nuclear to cytoplasmic TDP-43 in individual iMNs treated with 10 nM inactive 3K3A-APC or 3K3A-APC for 6 days. iMNs from 2 controls and 2 C9-ALS patients (H) or 4 sporadic ALS patients (I) were quantified. n = 30 (controls), 30 (C9-ALS), or 36 (sporadic) iMNs per line per condition from 2 biologically independent iMN conversions of 2 control, 2 C9-ALS, or 4 sporadic ALS lines were quantified. Each gray circle represents a single iMN. Median ± interquartile range. Unpaired Mann-Whitney test. Scale bars: 5 μm. Dotted lines outline the nucleus and cell body. For iMN survival experiments, significance was measure by 2-sided log-rank test using the entire survival time course. The day of differentiation stated on each panel indicates the day of differentiation on which the experimental treatment or time course was initiated.
Figure 2
Figure 2. C9ORF72 and sporadic ALS iMNs share autophagosome formation abnormalities that are rescued by 3K3A-APC.
(A) mRFP-GFP-LC3 fluorescence in control, C9-ALS, or sporadic ALS (sALS) iMNs treated with or without 50 nM bafilomycin and 10 nM inactive 3K3A-APC or 3K3A-APC. Scale bars: 5 μm. Solid and dotted lines outline the cell body and nucleus, respectively. Cell bodies were visualized with mRFP-GFP-LC3 fluorescence using a longer exposure and increased gain. (B and C) Number of RFP+GFP+ vesicles per iMN in control, C9-ALS (B), or sporadic ALS (C) iMNs treated with 10 nM inactive 3K3A-APC or 3K3A-APC and 50 nM bafilomycin for 24 hours. iMNs from 3 controls, 3 C9-ALS (B), and 5 sporadic ALS (C) patients were quantified. n = 12 iMNs per line per condition across 2 independent iMN conversions were quantified. Each gray circle represents a single iMN. Median ± interquartile range. Kruskal-Wallis testing. (D) qRT-PCR analysis of mRNA levels of ATG5 and ATG10 in C9-ALS iMNs treated with 10 nM inactive 3K3A-APC or 3K3A-APC for 3 days. n = 4 independent iMN conversions and treatments per condition. Each gray circle represents a single RNA sample. Mean ± SD. Two-tailed t test, unpaired. (E) Number of LAMP2+ vesicles in control or C9-ALS iMNs treated with 10 nM inactive 3K3A-APC or 3K3A-APC for 24 hours. iMNs from 2 controls and 2 C9-ALS patients were quantified. n = 21 iMNs per line per condition across 2 independent iMN conversions were quantified. Each gray circle represents a single iMN. Mean ± SEM. One-way ANOVA. (F) Number of LAMP2+ vesicles in control or sporadic ALS iMNs treated with 10 nM inactive 3K3A-APC or 3K3A-APC for 24 hours. Each gray circle represents a single iMN. iMNs from 2 controls and 6 sporadic ALS patients were quantified. n = 33 iMNs per line per condition across 2 independent iMN conversions were quantified. Median ± interquartile range. Kruskal-Wallis testing. The day of differentiation stated on each panel indicates the day of differentiation on which the experimental treatment or time course was initiated.
Figure 3
Figure 3. Rescue of autophagosome formation by 3K3A-APC improves proteostasis.
(AC) Immunostaining (A) and quantification (B and C) to determine endogenous poly(GR)+ punctae in control or C9-ALS iMNs with 10 nM inactive 3K3A-APC or 3K3A-APC treatment for 6 days. Quantified values represent the average number of nuclear poly(GR)+ punctae in n = 30 iMNs (controls) or 40 to 44 iMNs (C9-ALS) per line per condition from 2 control or 2 C9-ALS patient lines. For each line, iMNs were quantified from 2 independent iMN conversions per line per condition. Median ± interquartile range. Each gray circle represents the number of poly(GR)+ punctae/unit area in a single iMN. Mann-Whitney testing. Solid and dotted lines in A outline the cell body and nucleus, respectively. Scale bars: 5 μm. (D and E) Dot blot (D) and quantification (E) of poly(GR)+ levels in iMNs from 2 C9-ALS patient lines with 10 nM inactive 3K3A-APC or 3K3A-APC treatment for 6 days. Each gray circle represents 1 dot blot sample. Mean ± SD. n = 3 independent iMN conversions per line per condition. One-way ANOVA with Tukey’s correction across all comparisons. (F) Survival of control iMNs without excess glutamate with overexpression of eGFP or GR(50)-eGFP and 10 nM inactive or active 3K3A-APC. n = 90 iMNs per condition, iMNs quantified from 3 biologically independent iMN conversions. Two-sided log-rank test, corrected for multiple comparisons, statistical significance was calculated using the entire survival time course. n = 90 iMNs per condition. (GJ) Immunofluorescence analysis of total TDP-43 (G) and quantification of the ratio of nuclear to cytoplasmic TDP-43 in control, C9-ALS (H), or sporadic ALS iMNs (I and J). Ratio of nuclear to cytoplasmic TDP-43 in individual C9-ALS iMNs treated with 10 nM inactive 3K3A-APC or 3K3A-APC for 6 days. iMNs from 2 controls, 2 C9-ALS, and 4 sporadic ALS patients were quantified. n = 30 iMNs per line (control and C9-ALS) per condition or n = 26 iMNs (I), 30 iMNs (J) (inactive 3K3A-APC), or n = 35 iMNs (J) (3K3A-APC) (sporadic ALS) per condition per line from 2 biologically independent iMN conversions were quantified. Each gray circle represents a single iMN. For H, median ± interquartile range. Kruskal-Wallis testing. For I and J, mean ± SEM. Unpaired t test with Welch’s correction. Scale bars: 5 μm. Dotted lines outline the nucleus and cell body. The day of differentiation stated on each panel indicates the day of differentiation on which the experimental treatment or time course was initiated.
Figure 4
Figure 4. C9ORF72 and sporadic ALS iMNs have elevated glutamate receptor levels that are normalized by 3K3A-APC.
(A) Immunofluorescence images showing NR1+ punctae on neurites of iMNs treated with 10 nM inactive 3K3A-APC or 3K3A-APC for 6 days. Scale bar: 2 μm. This experiment was repeated 3 times with similar results. (B and C) NR1+ punctae per unit area in control, C9-ALS (B), or sporadic ALS (C) iMNs. Each gray circle represents the number of NR1+ punctae per area unit on a single neurite (1 neurite quantified per iMN). n = 33 (controls and C9-ALS) or 13 (sporadic) iMNs quantified per line per condition from 2 biologically independent iMN conversions of 2 CTRL, 2 C9-ALS, or 6 sporadic ALS lines. Median ± interquartile range. Kruskal-Wallis testing. (D) Number of calcium transients per 30 seconds in control or C9-ALS iMNs treated with 10 nM inactive 3K3A-APC or 3K3A-APC. n = 21 iMNs per line per condition from 3 biologically independent iMN conversions of 3 CTRL and 3 C9-ALS lines. For the C9-ALS plus 3K3A-APC condition, n = 19 iMNs per line. Median ± interquartile range. Kruskal-Wallis testing. (E) Number of calcium transients per 30 seconds in control or sporadic ALS iMNs treated with inactive 3K3A-APC or 3K3A-APC. n = 20 iMNs per line per condition from 3 biologically independent iMN conversions of 3 CTRL and 1 sporadic line. Median ± interquartile range. Kruskal-Wallis testing. (F) Immunoblotting of surface NR1 after surface protein biotinylation in C9-ALS iMNs generated with NGN2, ISL1, and LHX3 and treated with 10 nM inactive 3K3A-APC or 3K3A-APC for 6 days. (G) Quantification of NR1 immunoblotting from F. n = 4 biologically independent iMN conversions. Each gray circle represents an individual sample. The ratio of surface to total transferrin receptor was used to normalize for the membrane protein extraction efficiency and TUJ1 was used to normalize for neuron number. (H) Immunoblotting of surface NR1 after surface protein biotinylation in sporadic ALS iMNs (1 patient) generated with NGN2, ISL1, and LHX3 and treated with 10 nM inactive 3K3A-APC or 3K3A-APC for 6 days. The full blot for total TUJ1 is shown. (I) Quantification of NR1 immunoblotting from H. n = 4 biologically independent iMN conversions. Each gray circle represents an individual sample. The ratio of surface to total transferrin receptor was used to normalize for the membrane protein extraction efficiency and TUJ1 was used to normalize for neuron number. The day of differentiation stated on each panel indicates the day of differentiation on which the experimental treatment or time course was initiated. TF, transferrin.
Figure 5
Figure 5. 3K3A-APC rescues the survival of C9ORF72 and sporadic ALS iMNs in a PAR1-dependent manner.
(A) Survival of iMNs from 3 control or 1 SOD1A4V ALS patient line in excess glutamate with 10 nM inactive 3K3A-APC or 3K3A-APC. n = 90 iMNs per line per condition, iMNs from all control lines shown in aggregate for clarity. iMNs quantified from 3 biologically independent iMN conversions per line. (B) Survival of iMNs from 2 C9-ALS lines in excess glutamate with inactive 3K3A-APC or different concentrations of 3K3A-APC. n = 90 iMNs per line per condition, iMNs from both lines shown in aggregate for clarity. iMNs quantified from 3 biologically independent iMN conversions per line. (C) C9-ALS iMNs on day 12 of survival in excess glutamate with inactive 3K3A-APC or 3K3A-APC treatment. This experiment was repeated 3 times with similar results. Scale bar: 100 μm. (D) Survival of control iMNs in excess glutamate with 10 nM inactive 3K3A-APC or 3K3A-APC, n = 90 iMNs per line per condition for 3 control and 3 C9-ALS lines, iMNs quantified from 3 biologically independent iMN conversions per line. (EG) Survival of iMNs from 2 C9-ALS lines in excess glutamate with 3K3A-APC with or without 3 μM PAR1 antagonist treatment (E) or PAR2 antagonist treatment (F). n = 90 iMNs per line per condition, iMNs from both lines shown in aggregate for clarity. iMNs quantified from 3 biologically independent iMN conversions per line. Survival of iMNs from 2 C9-ALS lines in excess glutamate with 3K3A-APC with or without 9 μM PAR1 ASO treatment (G). n = 90 iMNs per line per condition, iMNs from both lines shown in aggregate for clarity. iMNs quantified from 3 biologically independent iMN conversions per line. Each trace includes neurons from 2 donors with the specified genotype. All iMN survival experiments were analyzed by 2-sided log-rank test and corrected for multiple comparisons if applicable. Statistical significance was calculated using the entire survival time course. (H and I) Survival of iMNs from sporadic ALS (sALS) clone 1 in excess glutamate with 10 nM inactive 3K3A-APC or 3K3A-APC (H), or with 3K3A-APC and DMSO or a PAR1 antagonist (I). n = 90 iMNs per condition. iMNs quantified from 3 biologically independent iMN conversions. For all iMN survival experiments, significance was measure by 2-sided log-rank test using the entire survival time course. The day of differentiation stated on each panel indicates the day of differentiation on which the experimental treatment or time course was initiated.
Figure 6
Figure 6. 3K3A-APC rescues C9ORF72 ALS proteostasis and glutamate receptor phenotypes in vivo.
(A) Overview of the experimental procedure for testing the ability of 3K3A-APC to reduce DPR levels in the hippocampus of C9-BAC mice. (BD) The effect of 10 nM inactive 3K3A-APC or 3K3A-APC on the level of poly(GR)+ punctae in the dentate gyrus of C9-BAC mice. Mean ± SD of the number of poly(GR)+ (B), poly(GP)+ (C), and poly(PR)+ (D) punctae per cell; each data point represents a single cell. Cells quantified from 3 mice per condition, 1-way ANOVA with Tukey’s correction for all comparisons. Scale bars: 10 μm. Dotted lines outline cell bodies. Neuronal area was determined by manual outlining in ImageJ on the basis of the staining pattern provided by TUJ1 or MAP2. (E) Overview of the experimental procedure for inducing NMDA injury in the hippocampus and testing the ability of 3K3A-APC to mitigate this injury. (F and G) The effect of 0.2 μg of 3K3A-APC delivered in a volume of 0.3 μL on NMDA-induced hippocampal injury in C9orf72+/+ and C9orf72+/– mice. Mean ± SEM of n = 3 mice per condition, 1-way ANOVA with Tukey’s correction across all comparisons. Red dashed lines outline the injury sites (F). Vehicle control conditions were published in a previous study (4). (H and I) Immunostaining (H) and quantification (I) of NR1 levels in C9orf72+/– mice treated with vehicle or 0.2 μg of 3K3A-APC delivered in a volume of 0.3 μL (n = 3 mice per condition, 72 cells quantified per condition). Each gray data point represents a single cell. Mean ± interquartile range. Mann-Whitney test.
Figure 7
Figure 7. Model depicting the detrimental effects and therapeutic treatment of the autophagosome and glutamate receptor phenotypes shared by C9ORF72 and sporadic ALS iMNs.

References

    1. Pihlstrøm L, Wiethoff S, Houlden H. Genetics of neurodegenerative diseases: an overview. Handb Clin Neurol. 2017;145:309–323. - PubMed
    1. Menzies FM, Fleming A, Rubinsztein DC. Compromised autophagy and neurodegenerative diseases. Nat Rev Neurosci. 2015;16(6):345–357. doi: 10.1038/nrn3961. - DOI - PubMed
    1. Ichida JK, Kiskinis E. Probing disorders of the nervous system using reprogramming approaches. EMBO J. 2015;34(11):1456–1477. doi: 10.15252/embj.201591267. - DOI - PMC - PubMed
    1. Shi Y, et al. Haploinsufficiency leads to neurodegeneration in C9ORF72 ALS/FTD human induced motor neurons. Nat Med. 2018;24(3):313–325. doi: 10.1038/nm.4490. - DOI - PMC - PubMed
    1. Wen X, et al. Antisense proline-arginine RAN dipeptides linked to C9ORF72-ALS/FTD form toxic nuclear aggregates that initiate in vitro and in vivo neuronal death. Neuron. 2014;84(6):1213–1225. doi: 10.1016/j.neuron.2014.12.010. - DOI - PMC - PubMed

Publication types

MeSH terms