Review
. 2019 Nov;25(11):3609-3624.
doi: 10.1111/gcb.14767. Epub 2019 Aug 16.

Estimating aboveground net biomass change for tropical and subtropical forests: Refinement of IPCC default rates using forest plot data

Affiliations
Review

Estimating aboveground net biomass change for tropical and subtropical forests: Refinement of IPCC default rates using forest plot data

Daniela Requena Suarez et al. Glob Chang Biol. 2019 Nov.

Abstract

As countries advance in greenhouse gas (GHG) accounting for climate change mitigation, consistent estimates of aboveground net biomass change (∆AGB) are needed. Countries with limited forest monitoring capabilities in the tropics and subtropics rely on IPCC 2006 default ∆AGB rates, which are values per ecological zone, per continent. Similarly, research into forest biomass change at a large scale also makes use of these rates. IPCC 2006 default rates come from a handful of studies, provide no uncertainty indications and do not distinguish between older secondary forests and old-growth forests. As part of the 2019 Refinement to the 2006 IPCC Guidelines for National Greenhouse Gas Inventories, we incorporate ∆AGB data available from 2006 onwards, comprising 176 chronosequences in secondary forests and 536 permanent plots in old-growth and managed/logged forests located in 42 countries in Africa, North and South America and Asia. We generated ∆AGB rate estimates for younger secondary forests (≤20 years), older secondary forests (>20 years and up to 100 years) and old-growth forests, and accounted for uncertainties in our estimates. In tropical rainforests, for which data availability was the highest, our ∆AGB rate estimates ranged from 3.4 (Asia) to 7.6 (Africa) Mg ha-1 year-1 in younger secondary forests, from 2.3 (North and South America) to 3.5 (Africa) Mg ha-1 year-1 in older secondary forests, and 0.7 (Asia) to 1.3 (Africa) Mg ha-1 year-1 in old-growth forests. We provide a rigorous and traceable refinement of the IPCC 2006 default rates in tropical and subtropical ecological zones, and identify which areas require more research on ∆AGB. In this respect, this study should be considered as an important step towards quantifying the role of tropical and subtropical forests as carbon sinks with higher accuracy; our new rates can be used for large-scale GHG accounting by governmental bodies, nongovernmental organizations and in scientific research.

Keywords: (sub)tropical forests; IPCC; biomass change; global ecological zones; managed and logged forests; old-growth forests; secondary forests.


Figures

Figure 1
Figure 1
Examples of (a) an aboveground biomass (AGB)–stand age relationship in a given chronosequence in a secondary forest and (b) ∆AGB rates in a given permanent plot in an old‐growth forest. In (a), grey dots indicate AGB plot values. ∆AGB rates are calculated by obtaining two slopes per growth curve (the black curve): one for younger secondary forests (0–20 years; red line) and another one for older secondary forests (20 years to the maximum age available at a given site; blue line). In (b), grey dots indicate ∆AGB rates derived from consecutive census in a given plot, with the red dot showing the mean value across censuses for that plot
Figure 2
Figure 2
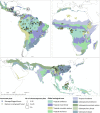
Distribution of chronosequences and permanent plots. Coloured areas show the extent of global ecological zones (according to FAO, 2012) included in this study; subtropical ecozones are hatched. Chronosequences are indicated with hollow circles; symbol size varies with the number of plots per chronosequence. Permanent plots are indicated with blue (managed/logged forests) and yellow (old‐growth forests) circles
Figure 3
Figure 3
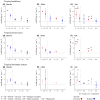
Comparison of previous IPCC 2006 default aboveground net biomass change (∆AGB) rates with refined default rates per continent and forest type in tropical rainforests (a, b, c), tropical moist forests (d, e, f) and tropical mountain systems (g, h, i). Previous (in red) ∆AGB rates (Mg ha−1 year−1) were divided into forests ≤20 years and forests >20 years old. Our refined (in blue) ∆AGB rates are divided into younger secondary forests, older secondary forests and old‐growth forests. Vertical continuous lines represent ranges for previous default rates and CI (95%) for refined default rates, and vertical dashed lines represent SD. For Asia, previous rates were divided into continental and insular values. The grey vertical line divides forests ≤20 years and younger secondary forests from the other forest types
Figure 4
Figure 4
Relationships between aboveground biomass (AGB) and stand age in tropical rainforests (a, b, c), tropical moist forests (d, e, f) and tropical mountain systems (g, h, i) for secondary forests. AGB plots and chronosequences are represented in grey dots and grey curves respectively. Overall relationships between AGB and stand age for each ecozone are presented in red. The dashed vertical line divides the graph into younger secondary (≤20 year) and older secondary (>20 years) forests. Data from managed/logged forests were not included in this figure. For other ecozones, data were not available across all three continents
Figure 5
Figure 5
Aboveground net biomass change (∆AGB) rates in old‐growth (a) tropical rainforests, (b) tropical moist forests and (c) tropical mountain systems. Plot‐specific ∆AGB rates are represented in grey. Red dots represent the mean ∆AGB rate per ecozone. Two values (−16.24 and −10.84) in tropical rainforests in Africa were excluded from (a)
Figure 6
Figure 6
Aboveground net biomass change (∆AGB) rates in managed/logged (a) tropical rainforests and (b) tropical moist forests. Plot‐specific ∆AGB rates are represented in grey. Red dots represent the mean ∆AGB rate per ecozone
Figure 7
Figure 7
Chronosequence and permanent plot density per 100,000 km2 of natural forests in tropical and subtropical ecozones. Extent of natural forests were obtained from Schulze, Malek, and Verburg (2019) and combined with FAO (2012) to obtain coarse estimates of natural forest area per ecozone. A full list of chronosequence and plot density can be found in Appendix S3

References

    1. Achard, F. , Beuchle, R. , Mayaux, P. , Stibig, H.‐J. , Bodart, C. , Brink, A. , … Simonetti, D. (2014). Determination of tropical deforestation rates and related carbon losses from 1990 to 2010. Global Change Biology, 20(8), 2540–2554. 10.1111/gcb.12605 - DOI - PMC - PubMed
    1. Alves, D. , Soares, J. V. , Amarral, S. , Mello, E. , Almeida, S. , Da Silva, O. F. , & Silveira, A. (1997). Biomass of primary and secondary vegetation in Rondonia, Western Brazilian Amazon. Global Change Biology, 3(5), 451–461. 10.1046/j.1365-2486.1997.00081.x - DOI
    1. Anderson‐Teixeira, K. J. , Hermman, V. , Wang, M. M. H. , Bond‐Lamberty, B. , LeBauer, D. , & Sanchez Padial, A. J. (2018). forc‐db/ForC: Version for IPCC 2019 updated default tables for biomass growth of natural forests in the (sub)tropics. 10.5281/ZENODO.1230565 - DOI
    1. Anderson‐Teixeira, K. J. , Wang, M. M. H. , McGarvey, J. C. , Herrmann, V. , Tepley, A. J. , Bond‐Lamberty, B. , & LeBauer, D. S. (2018). ForC: A global database of forest carbon stocks and fluxes. Ecology, 99(6), 1507–1507. 10.1002/ecy.2229 - DOI - PubMed
    1. Anderson‐Teixeira, K. J. , Wang, M. M. H. , McGarvey, J. C. , & LeBauer, D. S. (2016). Carbon dynamics of mature and regrowth tropical forests derived from a pantropical database (TropForC‐db). Global Change Biology, 22(5), 1690–1709. 10.1111/gcb.13226 - DOI - PubMed

Publication types