. 2019 Oct;33(10):11349-11363.
doi: 10.1096/fj.201900485R. Epub 2019 Jul 16.

Cilantro leaf harbors a potent potassium channel-activating anticonvulsant

Affiliations

Cilantro leaf harbors a potent potassium channel-activating anticonvulsant

Rían W Manville et al. FASEB J. 2019 Oct.

Abstract

Herbs have a long history of use as folk medicine anticonvulsants, yet the underlying mechanisms often remain unknown. Neuronal voltage-gated potassium channel subfamily Q (KCNQ) dysfunction can cause severe epileptic encephalopathies that are resistant to modern anticonvulsants. Here we report that cilantro (Coriandrum sativum), a widely used culinary herb that also exhibits antiepileptic and other therapeutic activities, is a highly potent KCNQ channel activator. Screening of cilantro leaf metabolites revealed that one, the long-chain fatty aldehyde (E)-2-dodecenal, activates multiple KCNQs, including the predominant neuronal isoform, KCNQ2/KCNQ3 [half maximal effective concentration (EC50), 60 ± 20 nM], and the predominant cardiac isoform, KCNQ1 in complexes with the type I transmembrane ancillary subunit (KCNE1) (EC50, 260 ± 100 nM). (E)-2-dodecenal also recapitulated the anticonvulsant action of cilantro, delaying pentylene tetrazole-induced seizures. In silico docking and mutagenesis studies identified the (E)-2-dodecenal binding site, juxtaposed between residues on the KCNQ S5 transmembrane segment and S4-5 linker. The results provide a molecular basis for the therapeutic actions of cilantro and indicate that this ubiquitous culinary herb is surprisingly influential upon clinically important KCNQ channels.-Manville, R. W., Abbott, G. W. Cilantro leaf harbors a potent potassium channel-activating anticonvulsant.

Keywords: KCNQ1; KCNQ2; KCNQ3; epilepsy; herbal medicine.


Conflict of interest statement

The authors are grateful to Angele De Silva (University of California–Irvine) for generating mutant channel constructs, and to Bo Abbott for botanical photography. This study was supported by the U.S. National Institutes of Health (NIH) National Institute of General Medical Sciences (Grants GM115189 and GM130377 to G.W.A.) and NIH National Institute of Neurological Disorders and Stroke (Grant NS107671 to G.W.A.). The authors declare no conflicts of interest.

Figures
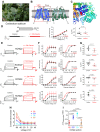
Figure 1
Figure 1
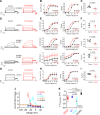
Cilantro extract differentially activates homomeric KCNQ channels All error bars indicate sem. A) Image of the fresh cilantro (Coriander sativum) used in this study. B) Topological representation of a Kv channel showing 2 of the 4 subunits that comprise a channel. C) Extracellular view of the chimeric KCNQ1/KCNQ3 structural model to highlight the anticonvulsant binding pocket (red, KCNQ3-W265). D) Left, mean TEVC current traces for water-injected Xenopus oocytes in the absence (control) or presence of 1% cilantro extract (n = 5). Dashed line here and throughout indicates the 0 current level. Upper inset: the voltage protocol used here and throughout the study unless otherwise indicated. Center: mean tail current for oocytes on left (n = 5). Right: scatter plot of resting membrane potential (EM) of water-injected oocytes in the absence (Control) or presence of cilantro extract (n = 5). Statistical analyses by 2-way ANOVA. E) Left: mean TEVC current traces for Xenopus oocytes expressing the KCNQ homomers indicated in the absence (control) or presence of 1% cilantro extract (n = 5–6). Arrow indicates time point at which KCNQ tail currents are measured throughout this study. F) Mean tail current (left) and normalized tail current (G/Gmax) (right) vs. prepulse voltage relationships for the traces as in the previous panel (n = 5–6). G) Effects of 1% cilantro extract on EM of unclamped oocytes expressing the channels as in E (n = 5–6). Statistical analyses by 2-way ANOVA. H) Current-fold increase vs. voltage for the KCNQ isoforms indicated, induced by 1% cilantro extract (n = 5–6). I) Scatter plot showing mean ΔV0.5 activation induced by 1% cilantro extract for the KCNQ isoforms indicated (n = 5–6). Statistical analysis by 2-way ANOVA corrected for multiple comparisons.
Figure 2
Figure 2
Cilantro extract differentially activates heteromeric KCNQ channels All error bars indicate sem. A) Left, mean TEVC current traces for Xenopus oocytes expressing KCNQ2/3 in the absence (control) or presence of 1% cilantro extract (n = 6). B) Mean tail current (left) and normalized tail current (G/Gmax) (right) vs. prepulse voltage relationships for the KCNQ2/3 traces as in A (n = 6). C) Effects of 1% cilantro extract on EM of unclamped oocytes expressing KCNQ2/3 (n = 6). Statistical analysis by 2-way ANOVA. D) Left: mean TEVC current traces for Xenopus oocytes expressing homomeric KCNQ1 or heteromeric KCNQ1-KCNE channels as indicated in the absence (control) or presence of 1% cilantro extract (n = 5–6). E) Mean tail current (left) and normalized tail current (G/Gmax) (right) vs. prepulse voltage relationships for the traces as in D (n = 5–6). F) Effects of 1% cilantro extract on EM of unclamped oocytes expressing the channels indicated in D (n = 5–6). Statistical analysis by 2-way ANOVA. G) Left: mean TEVC current traces for Xenopus oocytes expressing homomeric KCNA1 in the absence (control) or presence of 1% cilantro extract (n = 6). H) Mean tail current (left) and normalized tail current (G/Gmax) (right) vs. prepulse voltage relationships for the traces as in G (n = 6). I) Effects of 1% cilantro extract on EM of unclamped oocytes expressing KCNA1 (n = 6). Statistical analysis by 2-way ANOVA. J) Current-fold increase vs. voltage for the Kv channel isoforms indicated, induced by 1% cilantro extract (n = 5–6). K) Scatter plot showing mean ΔV0.5 activation induced by 1% cilantro extract for the Kv channel isoforms indicated; n = 5–6. Statistical analysis by 2-way ANOVA corrected for multiple comparisons.
Figure 3
Figure 3
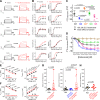
(E)-2-dodecenal is the KCNQ2/3-activating metabolite in cilantro All error bars indicate sem. Red box indicates the sole hit, (E)-2-dodecenal. A) Chemical structures (left; red indicates oxygen) and electrostatic surface plots (right; red, negative; blue, positive) of the cilantro compounds screened in this study. B) Mean TEVC current traces showing effects of compounds in A (all 100 µM) on KCNQ2/3 expressed in Xenopus oocytes (n = 5–11). C) Mean tail current (left) and normalized tail currents (G/Gmax) (right) vs. prepulse voltage relationships for the traces as in B (n = 5–11). 3,4-DHBA, 3,4-dihydroxybenzoic acid.
Figure 4
Figure 4
(E)-2-dodecenal and cilantro extract exhibit similar KCNQ isoform selectivity and anticonvulsant effects. All error bars indicate sem. A) Mean TEVC current traces showing effects of (E)-2-dodecenal (100 µM) on homomeric KCNQ channels expressed in Xenopus oocytes; n = 5 except for KCNQ2 (n = 3). B) Mean tail current (left) and normalized tail currents (G/Gmax) (right) vs. prepulse voltage relationships for the traces as in A; n = 5 except for KCNQ2 (n = 3). C) Mean ΔV0.5 activation induced by (E)-2-dodecenal (100 µM) (scatter plot) vs. mean effects of 1% cilantro extract (single bars indicate means from Figs. 1 and 2) for the homomeric KCNQ isoforms indicated; n = 5 except for KCNQ2 (n = 3). D) (E)-2-dodecenal dose responses for homomeric KCNQ1–5 channels (n = 3–5). E, F) Comparison of effects of 1% cilantro extract (E) vs. (E)-2-dodecenal (100 µM) (F) on KCNQ2/3 activation and deactivation rate vs. voltage; n = 6. G) Mean latency to first PTZ-induced seizure for mice preinjected with PBS (n = 16) vs. (E)-2-dodecenal (2 mg/kg) (n = 20) (left) or PBS (n = 29) vs. tridecanal (20 mg/kg) (n = 15) or (E)-2-dodecenal (20 mg/kg) (n = 15) (right). Statistical analysis was by 2-way ANOVA corrected for multiple comparisons. Gold squares = mean values. H) Mean latency to first PTZ-induced seizure for mice preinjected with PBS (n = 14) or 20 mg/kg (E)-2-dodecenal + 2.5 mg/kg XE991 (n = 13). Statistical analysis was by 2-way ANOVA.
Figure 5
Figure 5
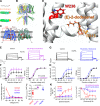
KCNQ2/3 activation by (E)-2-dodecenal requires a conserved S5 tryptophan and S4–5 arginine. All error bars indicate sem. A) (E)-2-dodecenal chemical structure (upper and center) and electrostatic surface potentials (red, electron-dense; blue, electron-poor; green, neutral) (lower and center) calculated and plotted using Jmol. B) Chimeric KCNQ1/KCNQ2 structural model (orange, KCNQ2-R213; red, KCNQ2-W236). C) Topological representation of KCNQ5 showing 2 of the 4 subunits, without domain swapping for clarity. Pentagons, approximate position of KCNQ2-R213 (orange) and KCNQ2-W236 (red); D) View of the (E)-2-dodecenal binding site in KCNQ2 predicted by SwissDock. Green line, predicted H-bond. E) Mean TEVC current traces showing effects of (E)-2-dodecenal (100 µM) on KCNQ2-W236L/KCNQ3-W265L (WL/WL) channels expressed in Xenopus oocytes (n = 5–6). F) Mean tail current (left) and mean normalized tail currents (G/Gmax) (right) vs. prepulse voltage relationships for the traces as in E (n = 5–6). G) Mean TEVC current traces showing effects of (E)-2-dodecenal (100 µM) on KCNQ2-R213A/KCNQ3-R242 (RA/RA) channels expressed in Xenopus oocytes (n = 5–6). H) Mean tail current (left) and mean normalized tail currents (G/Gmax) (right) vs. prepulse voltage relationships for the traces as in G (n = 5–6). I) Current-fold increase vs. voltage in response to (E)-2-dodecenal (100 µM) of wild-type (Q2/Q3), WL/WL, and RA/RA KCNQ2/3 channels (n = 5–6). J) Scatter plot showing ΔV0.5 activation in response to (E)-2-dodecenal (100 µM) of wild-type (Q2/Q3), WL/WL and RA/RA KCNQ2/3 channels (n = 5–6). K) (E)-2-dodecenal dose response calculated from fold increase in current at −60 mV (left) and ΔV0.5 activation (right) for wild-type (Q2/Q3), WL/WL, and RA/RA KCNQ2/3 channels; n = 5–6.
Figure 6
Figure 6
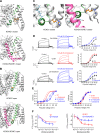
KCNQ2-R213 is essential for KCNQ2/3 activation by (E)-2-dodecenal. All error bars indicate sem. A) Mean TEVC current traces showing effects of (E)-2-dodecenal (100 µM) on KCNQ2/KCNQ3-W265L (upper) and KCNQ2-W236L/KCNQ3 (lower) channels expressed in Xenopus oocytes (n = 5–6). B) Mean tail currents (left) and mean normalized tail currents (G/Gmax) (right) vs. prepulse voltage relationships for the traces as in A (n = 5–6). C) (E)-2-dodecenal dose response calculated from ΔV0.5 activation for wild-type, double-mutant (from Fig. 5), and single-mutant KCNQ2/3 channels as indicated; n = 5–6. D) Mean TEVC current traces showing effects of (E)-2-dodecenal (100 µM) on KCNQ2/KCNQ3-R242A (upper) and KCNQ2-R213A/KCNQ3 (lower) channels expressed in Xenopus oocytes (n = 5). E) Mean tail currents (left) and mean normalized tail currents (G/Gmax) (right) vs. prepulse voltage relationships for the traces as in D (n = 5). F) (E)-2-dodecenal dose response calculated from ΔV0.5 activation for wild-type, double-mutant (from Fig. 5), and single-mutant KCNQ2/3 channels as indicated (n = 5).
Figure 7
Figure 7
KCNE1 impinges on the KCNQ1 (E)-2-dodecenal binding site. All error bars indicate sem. For structural models: Pink, KCNE1; pale green, KCNQ1-S4; forest green, KCNQ1-S4/5 linker; orange, KCNQ1-R243; pale blue, (E)-2-dodecenal. A) View of the (E)-2-dodecenal binding site predicted by SwissDock in the KCNQ1 (upper) and KCNQ1/KCNE1 (lower) closed-state models. B) View of the (E)-2-dodecenal binding site predicted by SwissDock in the KCNQ1 (upper) and KCNQ1/KCNE1 (lower) open-state models. C) Close-up view of the (E)-2-dodecenal binding site predicted by SwissDock (from A), highlighting the predicted KCNE1-induced shift in the (E)-2-dodecenal binding pose in the closed-state models. D) Mean TEVC current traces (left) and mean tail current vs. prepulse voltage relationships (right) showing effects of (E)-2-dodecenal (100 µM) on channels indicated (n = 5). E) Mean normalized tail current (G/Gmax) vs. prepulse voltage relationships showing effects of (E)-2-dodecenal (100 µM) (dashed lines) on the voltage dependence of activation of wild-type and R243A KCNQ1 (Q1) alone (left) or with KCNE1 (E1) (right); n = 5. Wild-type KCNQ1 data are from Fig 4B. F) (E)-2-dodecenal dose response calculated from ΔV0.5 activation for wild-type and R243A KCNQ1 (Q1) alone (left) or with KCNE1 (E1) (right); n = 5. Wild-type KCNQ1 data are from Fig. 4B.

Similar articles

Cited by

References

    1. Inskeep R. R. (1969) Health hazards and healing in antiquity. S. Afr. Archaeol. Bull. 24, 21–29
    1. Hardy K., Buckley S., Collins M. J., Estalrrich A., Brothwell D., Copeland L., García-Tabernero A., García-Vargas S., de la Rasilla M., Lalueza-Fox C., Huguet R., Bastir M., Santamaría D., Madella M., Wilson J., Cortés A. F., Rosas A. (2012) Neanderthal medics? Evidence for food, cooking, and medicinal plants entrapped in dental calculus. Naturwissenschaften 99, 617–626 - PubMed
    1. Weyrich L. S., Duchene S., Soubrier J., Arriola L., Llamas B., Breen J., Morris A. G., Alt K. W., Caramelli D., Dresely V., Farrell M., Farrer A. G., Francken M., Gully N., Haak W., Hardy K., Harvati K., Held P., Holmes E. C., Kaidonis J., Lalueza-Fox C., de la Rasilla M., Rosas A., Semal P., Soltysiak A., Townsend G., Usai D., Wahl J., Huson D. H., Dobney K., Cooper A. (2017) Neanderthal behaviour, diet, and disease inferred from ancient DNA in dental calculus. Nature 544, 357–361 - PubMed
    1. Melamed Y., Kislev M. E., Geffen E., Lev-Yadun S., Goren-Inbar N. (2016) The plant component of an Acheulian diet at Gesher Benot Ya’aqov, Israel. Proc. Natl. Acad. Sci. USA 113, 14674–14679 - PMC - PubMed
    1. Hoffmann D. (2003) Medical Herbalism: The Science and Practice of Herbal Medicine, Healing Arts Press, Rochester, VT, USA

Publication types