

GWAS and enrichment analyses of non-alcoholic fatty liver disease identify new trait-associated genes and pathways across eMERGE Network
- PMID: 31311600
- PMCID: PMC6636057
- DOI: 10.1186/s12916-019-1364-z
GWAS and enrichment analyses of non-alcoholic fatty liver disease identify new trait-associated genes and pathways across eMERGE Network
Abstract
Background: Non-alcoholic fatty liver disease (NAFLD) is a common chronic liver illness with a genetically heterogeneous background that can be accompanied by considerable morbidity and attendant health care costs. The pathogenesis and progression of NAFLD is complex with many unanswered questions. We conducted genome-wide association studies (GWASs) using both adult and pediatric participants from the Electronic Medical Records and Genomics (eMERGE) Network to identify novel genetic contributors to this condition.
Methods: First, a natural language processing (NLP) algorithm was developed, tested, and deployed at each site to identify 1106 NAFLD cases and 8571 controls and histological data from liver tissue in 235 available participants. These include 1242 pediatric participants (396 cases, 846 controls). The algorithm included billing codes, text queries, laboratory values, and medication records. Next, GWASs were performed on NAFLD cases and controls and case-only analyses using histologic scores and liver function tests adjusting for age, sex, site, ancestry, PC, and body mass index (BMI).
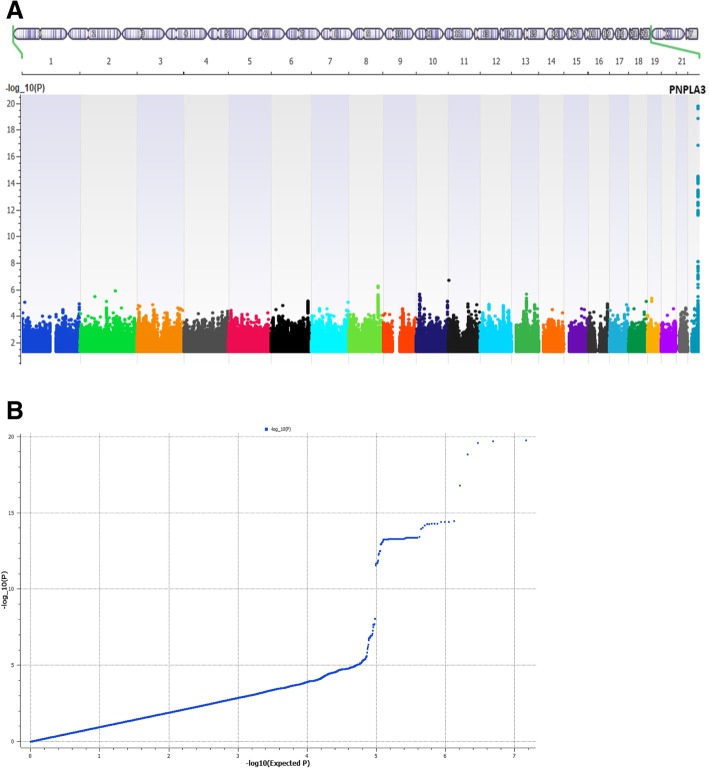
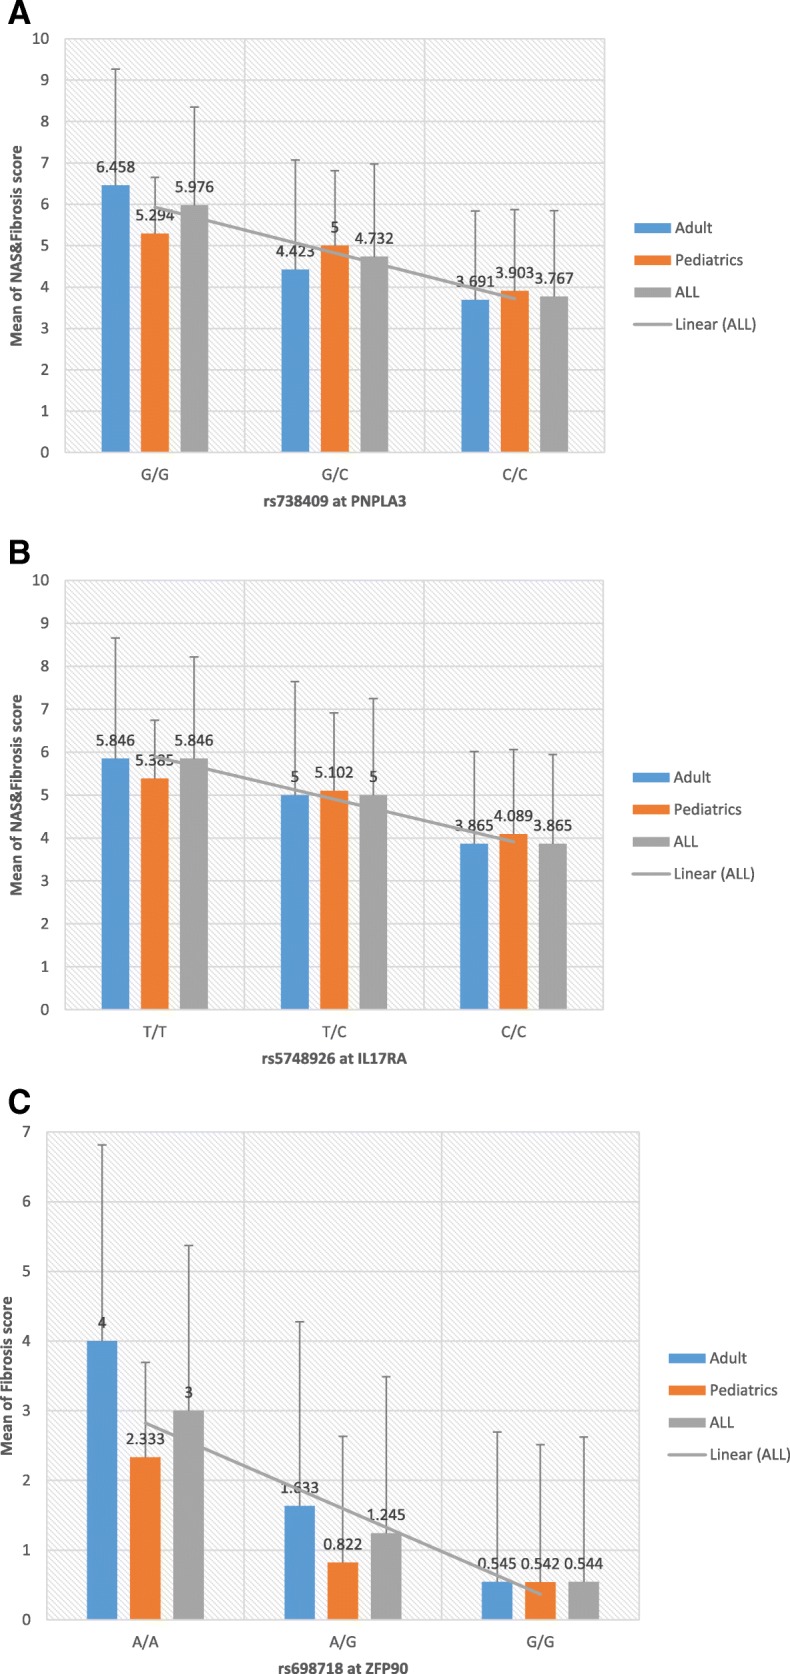
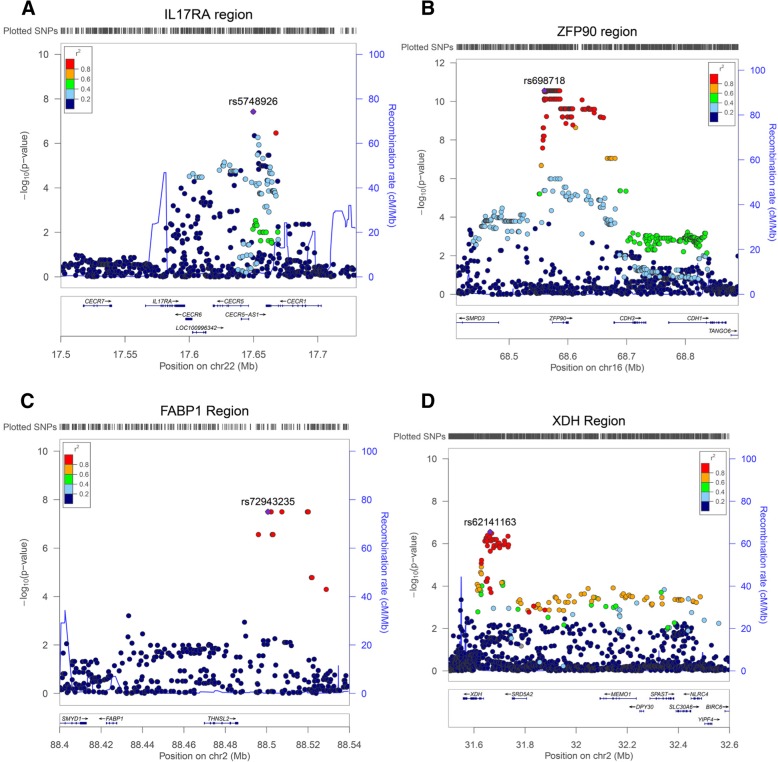
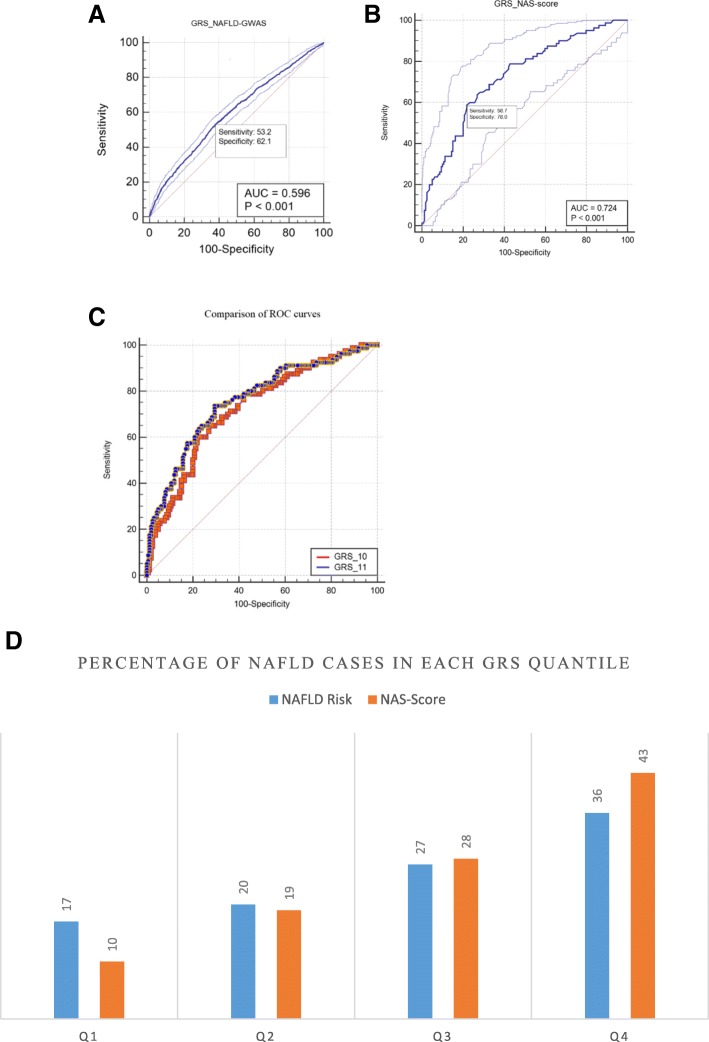
Results: Consistent with previous results, a robust association was detected for the PNPLA3 gene cluster in participants with European ancestry. At the PNPLA3-SAMM50 region, three SNPs, rs738409, rs738408, and rs3747207, showed strongest association (best SNP rs738409 p = 1.70 × 10- 20). This effect was consistent in both pediatric (p = 9.92 × 10- 6) and adult (p = 9.73 × 10- 15) cohorts. Additionally, this variant was also associated with disease severity and NAFLD Activity Score (NAS) (p = 3.94 × 10- 8, beta = 0.85). PheWAS analysis link this locus to a spectrum of liver diseases beyond NAFLD with a novel negative correlation with gout (p = 1.09 × 10- 4). We also identified novel loci for NAFLD disease severity, including one novel locus for NAS score near IL17RA (rs5748926, p = 3.80 × 10- 8), and another near ZFP90-CDH1 for fibrosis (rs698718, p = 2.74 × 10- 11). Post-GWAS and gene-based analyses identified more than 300 genes that were used for functional and pathway enrichment analyses.
Conclusions: In summary, this study demonstrates clear confirmation of a previously described NAFLD risk locus and several novel associations. Further collaborative studies including an ethnically diverse population with well-characterized liver histologic features of NAFLD are needed to further validate the novel findings.
Keywords: Fatty liver; GWAS; Genetic polymorphism; NAFLD; PheWAS; Polygenic risk score.
Conflict of interest statement
The authors declare that they have no competing interests.
Figures


References
Publication types
MeSH terms
Substances
Grants and funding
- U01 HG006828/HG/NHGRI NIH HHS/United States
- U01 HG008685/HG/NHGRI NIH HHS/United States
- U01 AI130830/AI/NIAID NIH HHS/United States
- U01 HG006380/HG/NHGRI NIH HHS/United States
- U01 HG008664/HG/NHGRI NIH HHS/United States
- U01 HG006388/HG/NHGRI NIH HHS/United States
- P30 DK078392/DK/NIDDK NIH HHS/United States
- U01 HG004438/HG/NHGRI NIH HHS/United States
- R01 DK099222/DK/NIDDK NIH HHS/United States
- U01 HG008679/HG/NHGRI NIH HHS/United States
- U01 HG006830/HG/NHGRI NIH HHS/United States
- U01 HG006385/HG/NHGRI NIH HHS/United States
- R01 AI024717/AI/NIAID NIH HHS/United States
- U01 HG008666/HG/NHGRI NIH HHS/United States
- R01 HL133786/HL/NHLBI NIH HHS/United States
- P30 AR070549/AR/NIAMS NIH HHS/United States
- U01 HG004424/HG/NHGRI NIH HHS/United States
- U01 HG008684/HG/NHGRI NIH HHS/United States
- T32 AR007534/AR/NIAMS NIH HHS/United States
- U01 HG008673/HG/NHGRI NIH HHS/United States
- I01 BX001834/BX/BLRD VA/United States
- U01 HG008657/HG/NHGRI NIH HHS/United States
- U01 HG008680/HG/NHGRI NIH HHS/United States
- U01 HG008701/HG/NHGRI NIH HHS/United States
- U01 HG006379/HG/NHGRI NIH HHS/United States
- U01 HG006378/HG/NHGRI NIH HHS/United States
- U01 HG006389/HG/NHGRI NIH HHS/United States
- U01 HG006375/HG/NHGRI NIH HHS/United States
LinkOut - more resources
Full Text Sources
Other Literature Sources
Medical
Miscellaneous
