. 2019 Jul 16;12(590):eaav7259.
doi: 10.1126/scisignal.aav7259.

Application of a MYC degradation screen identifies sensitivity to CDK9 inhibitors in KRAS-mutant pancreatic cancer

Affiliations

Application of a MYC degradation screen identifies sensitivity to CDK9 inhibitors in KRAS-mutant pancreatic cancer

Devon R Blake et al. Sci Signal. .

Abstract

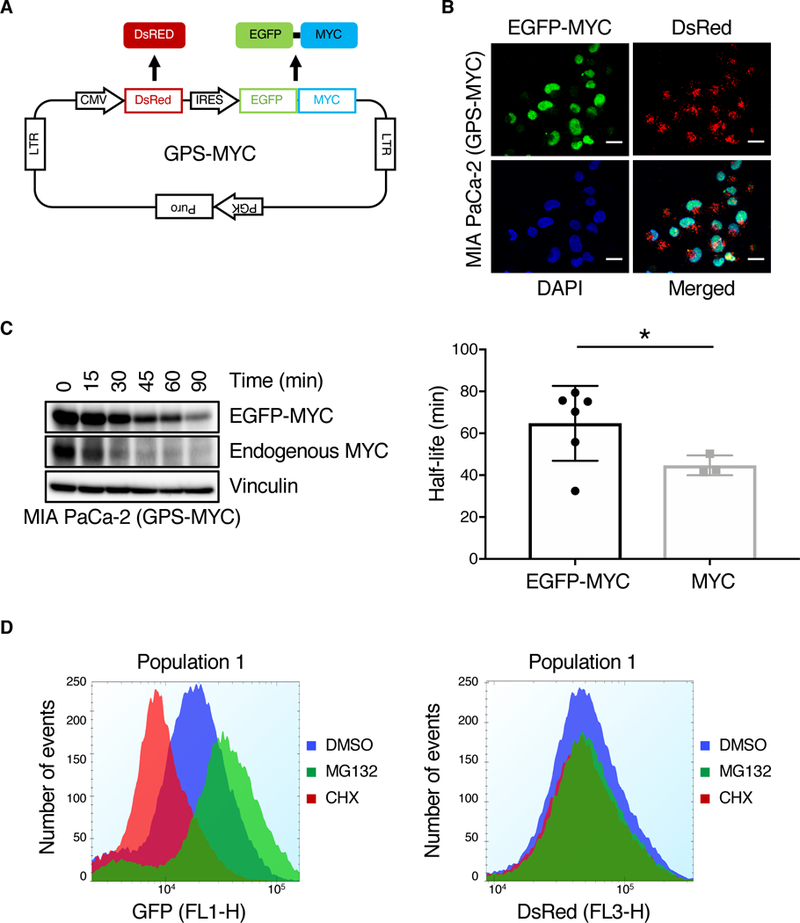
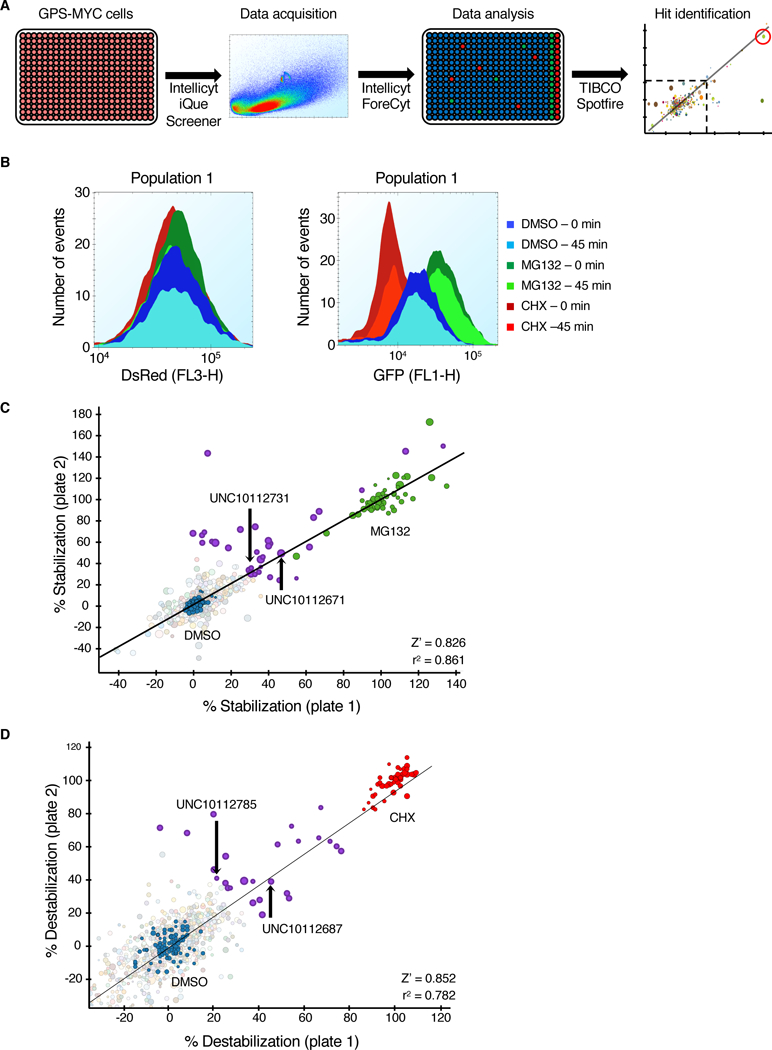
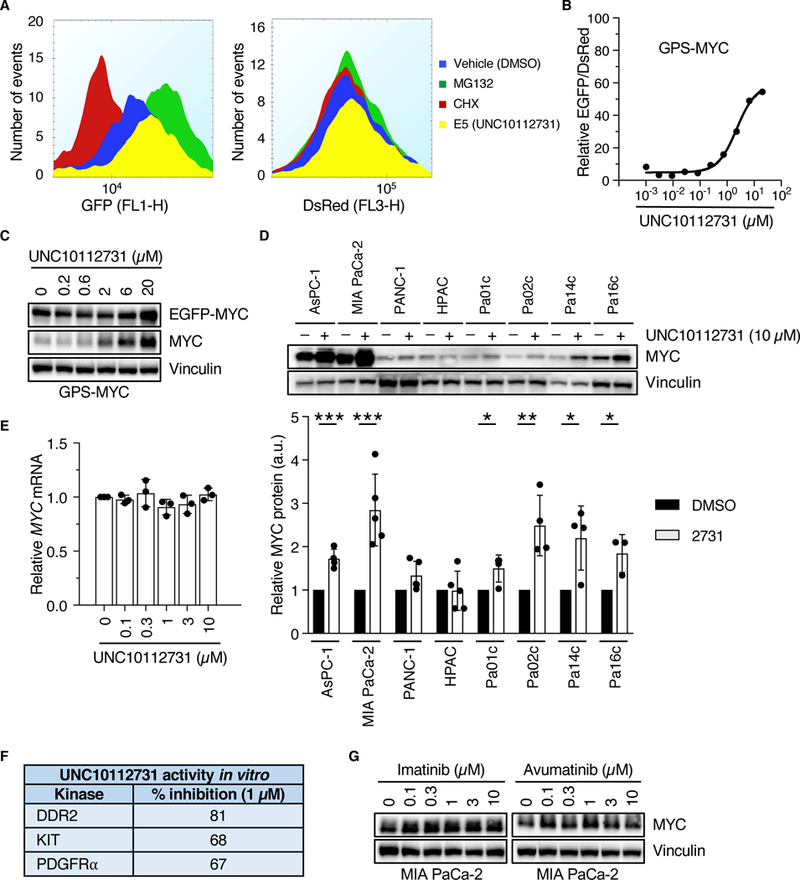
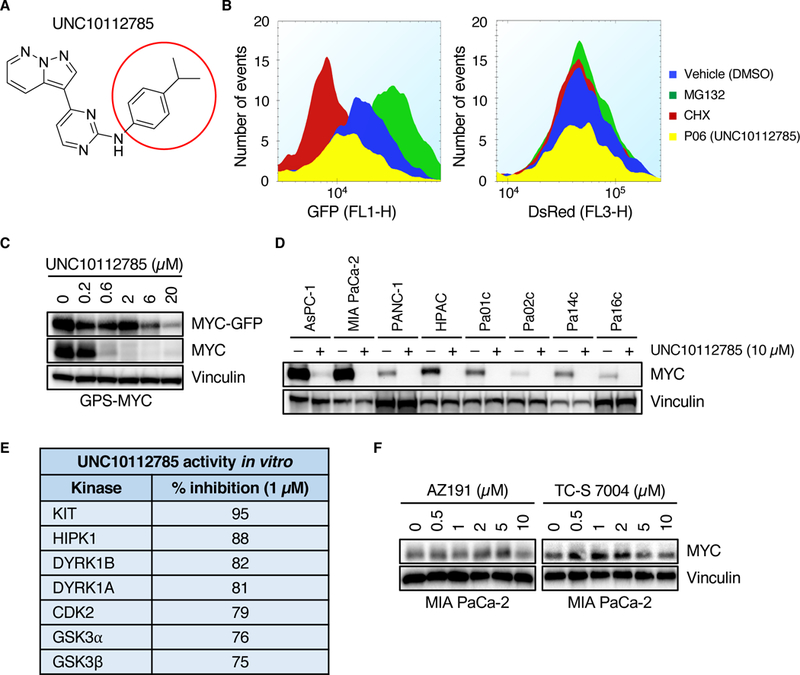
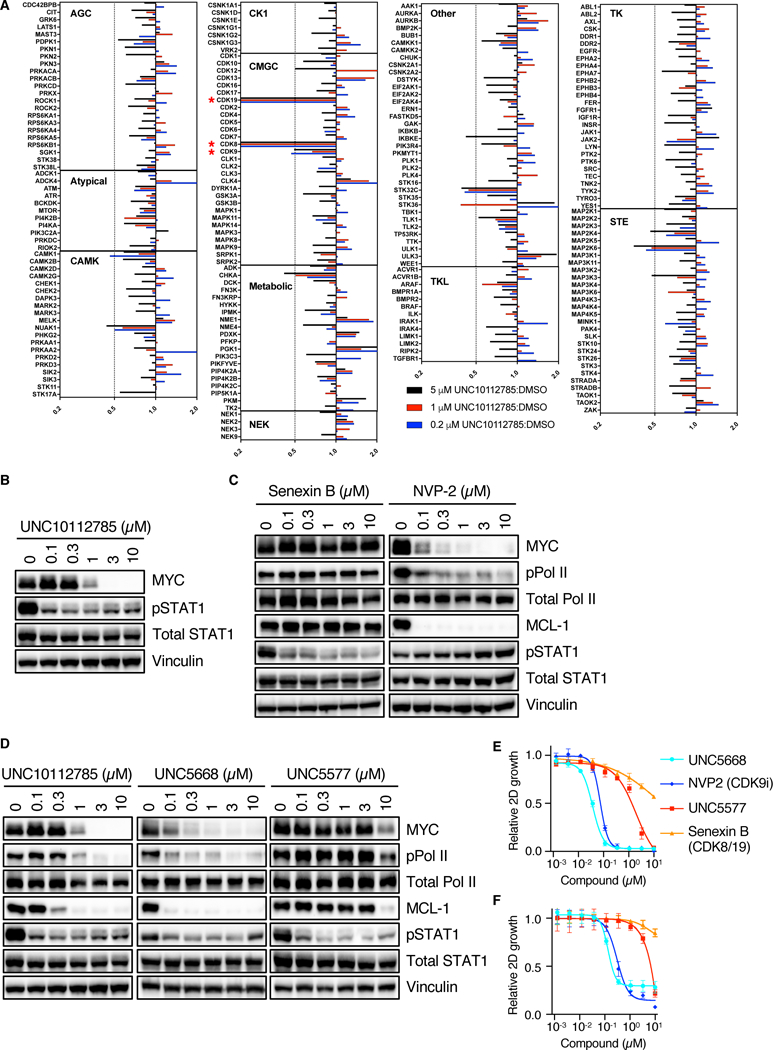
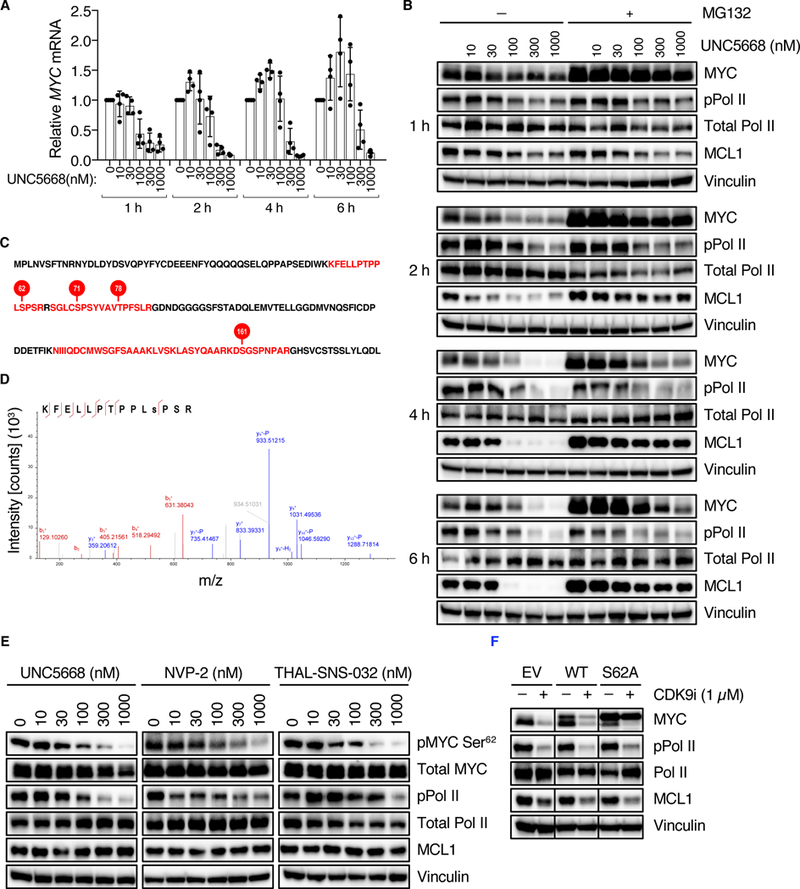
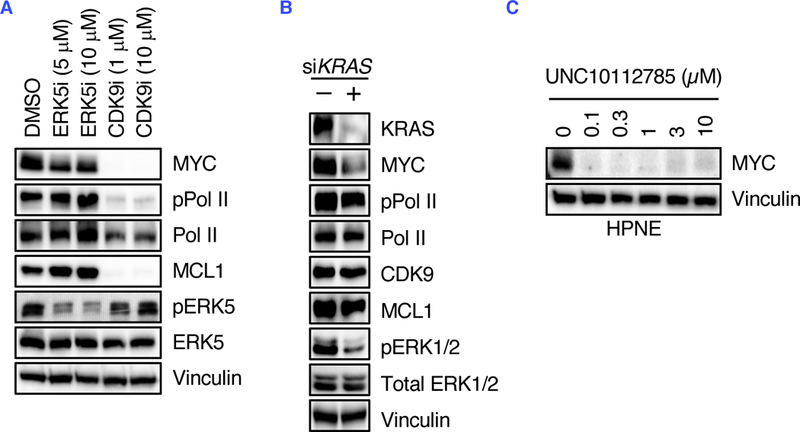
Stabilization of the MYC oncoprotein by KRAS signaling critically promotes the growth of pancreatic ductal adenocarcinoma (PDAC). Thus, understanding how MYC protein stability is regulated may lead to effective therapies. Here, we used a previously developed, flow cytometry-based assay that screened a library of >800 protein kinase inhibitors and identified compounds that promoted either the stability or degradation of MYC in a KRAS-mutant PDAC cell line. We validated compounds that stabilized or destabilized MYC and then focused on one compound, UNC10112785, that induced the substantial loss of MYC protein in both two-dimensional (2D) and 3D cell cultures. We determined that this compound is a potent CDK9 inhibitor with a previously uncharacterized scaffold, caused MYC loss through both transcriptional and posttranslational mechanisms, and suppresses PDAC anchorage-dependent and anchorage-independent growth. We discovered that CDK9 enhanced MYC protein stability through a previously unknown, KRAS-independent mechanism involving direct phosphorylation of MYC at Ser62 Our study thus not only identifies a potential therapeutic target for patients with KRAS-mutant PDAC but also presents the application of a screening strategy that can be more broadly adapted to identify regulators of protein stability.


Figures

Fig. 1.
Fig. 1.. Validation of a MYC degradation reporter.
(A) Overview of the GPS-MYC vector. (B) Confocal images of GPS-MYC cells to determine EGFP-MYC subcellular localization to the nucleus, which was visualized by DAPI staining. Scale bar = 20 μm. (C) GPS-MYC cells were treated with CHX for the indicated times and EGFP-MYC and MYC levels were measured by immunoblotting (left panel). The half-lives of EGFP-MYC and endogenous MYC were calculated by fitting the data to a one-phase decay curve. (D) GPS-MYC cells were treated with MG132 and cycloheximide for 6 hours and EGFP and DsRed (F) levels were measured by flow cytometry. All data are representative of at least three independent experiments.
Fig. 2.
Fig. 2.. Optimization of a MYC degradation screen.
(A) Schematic of the GPS-MYC screen. (B) GPS-MYC cells were treated with vehicle alone (DMSO), or with MG132 or CHX for 6 hours and analyzed on an Intellicyt iQue Screener. The data presented are from the first two and last two wells of each control, representing the beginning (0 min) and the end (45 min) of the assay. (C) The GPS-MYC screen was run in duplicate. Data were normalized to control DMSO (blue circles, 0% stabilization) and MG132 (green circles, 100% stabilization), and hits were determined by a cutoff of a 30% average stabilization of the two replicates. The circles representing the hits are shown in purple. The circle size is proportional to the number of events per well. Stabilizing compounds that were evaluated in the paper are labeled in the graph. (D) Same as (C), except the data were normalized to control DMSO (blue circles, 0% destabilization) and CHX (red circles, 100% destabilization). Destabilizing compounds evaluated in the paper are indicated.
Fig. 3.
Fig. 3.. MYC degradation screen identifies a compound that stabilizes MYC protein.
(A) GPS-MYC cells were treated with 20 μM UNC10112731 for 6 hr, and EGFP and DsRed intensities were measured by flow cytometry. Data are from the GPS-MYC screen. (B, C) GPS-MYC cells were treated with increasing concentrations of UNC10112731 for 6 hours and EGFP and DsRed intensities were measured by flow cytometry (B) or immunoblotting (C). (D) KRAS-mutant PDAC cell lines were treated for 6 hours with UNC10112731 and MYC protein levels were measured by immunoblotting (upper panel), with quantitation by densitometry relative to vehicle control (lower panel). Statistical significance was measured by t-test. *p<0.05, **p<0.01, ***p<0.001. (E) MIA PaCa-2 cells were treated for 6 hours with UNC10112731 and MYC mRNA levels were measured by qPCR. MYC mRNA levels were normalized to GAPDH mRNA levels. (F) Kinase selectivity of UNC10112731 as described previously (29). G) MIA PaCa-2 cells were treated for 6 hours with the indicated compounds and MYC protein levels were measured by immunoblot. All data are representative of at least three independent experiments. Data in (D) are presented as means ± SD.
Fig. 4.
Fig. 4.. UNC10112785 drives MYC protein loss.
(A) Chemical structure of UNC10112785. The red circle indicates the position at which different analogs were synthesized. (B) GPS-MYC cells were treated with 20 μM UNC10112785 for 6 hours and EGFP and DsRed intensity was measured by flow cytometry. Data from the GPS-MYC screen. (C) GPS-MYC cells were treated with UNC10112785 for 6 hours and EGFP-MYC and MYC levels were measured by immunoblotting. (D) PDAC cells were treated with UNC10112785 and MYC protein levels were measured by immunoblot. (E) Kinase selectivity of UNC10112785 as described previously (29). (F) MIA PaCa-2 cells were treated for 6 hours with the indicated compounds and MYC protein levels were measured by immunoblot. All data are representative of at least three independent experiments.
Fig. 5.
Fig. 5.. Inhibition of CDK9 by UNC10112785 drives MYC loss.
(A) MIA PaCa-2 cells were treated for 1 hour with different concentrations UNC10112785, after which they were lysed and applied to the MIBs column. Kinases were eluted from the column and identified and quantified by LC/MS as described in Methods. Bars to the left of center line indicate kinases reduced after compound addition. Data are from one experiment. (B) MIA PaCa-2 cells were treated with UNC10112785, and CDK8/19 inhibition was measured by pSTAT1 levels. (C, D) MIA PaCa-2 cells were treated with the indicated compounds for 6 hours and CDK8/19 and CDK9 inhibition was measured by pSTAT1 and pPol II, respectively. (E) MIA PaCa-2 cells were treated for 72 hours with the indicated compoundsCell proliferation was measured by cell count and normalized to cells treated with vehicle control (DMSO). (F) MIA PaCa-2 cells suspended in 3% agarose were treated for 72 hours with the indicated compounds. Cell proliferation was measured by alamarBlue and normalized to cells treated with vehicle (DMSO). All data are representative of at least three independent experiments unless otherwise indicated. Data in (E) and (F) are presented as means ± SD.
Fig. 6
Fig. 6. CDK9 regulates MYC protein stability through phosphorylation of Ser62.
(A) MIA PaCa-2 cells were treated with UNC5668. MYC mRNA levels were measured by qPCR and normalized to BACT mRNA levels. (B) MIA PaCa-2 cells were treated with UNC5668 in the presence or absence of MG132 for the indicated concentrations and times, and MYC protein levels were measured by immunoblot. (C) Recombinant CDK9 and MYC were incubated in the presence of ATP. After separation by SDS-PAGE, the band corresponding to MYC was excised and analyzed by LC/MS. MYC protein sequence: shown in red are phosphorylated peptides, and phosphorylated residues are indicated by red circles. The first 182 amino acids of MYC are shown. Data are from one experiment. (D) Tandem MS/MS spectrum for MYC peptide containing Ser62. (E) MIA PaCa-2 cells were treated for 30 min with the indicated compounds and pMYC Ser62 and total MYC levels were measured by immunoblot. (F) MIA PaCa-2 cells stably expressing MYC proteins were treated with the indicated compounds for 2 hours and MYC levels were measured by immunoblot. Blots are representative of five independent experiments. Other data are representative of at least three independent experiments unless otherwise indicated. Data in (A) are presented as means +/− SD.
Fig. 7.
Fig. 7.. CDK9 and MEK5-ERK5 comprise distinct signaling mechanisms that regulate MYC Ser62 phosphorylation and stability.
(A) MIA PaCa-2 cells were treated for 6 hours with XMD8–92 (ERK5i) and UNC5668 (CDK9i), and ERK5 and CDK9 signaling were measured by immunoblotting for the indicated proteins. (B) MIA PaCa-2 cells were treated with KRAS siRNA for 24 hours and CDK9 signaling was measured by immunoblotting for the indicated proteins. (C) HPNE cells were treated for 6 hours with the indicated concentrations of UNC10112785 and MYC levels were measured by immunoblotting for the indicated proteins. Data are representative of at least three independent experiments.

References

    1. Siegel RL, Miller KD, Jemal A, Cancer statistics, 2018. CA Cancer J Clin 68, 7–30 (2018). - PubMed
    1. Rahib L et al., Projecting cancer incidence and deaths to 2030: the unexpected burden of thyroid, liver, and pancreas cancers in the United States. Cancer Res 74, 2913–2921 (2014). - PubMed
    1. Waters AM, Der CJ, KRAS: the critical driver and therapeutic target for pancreatic cancer. Cold Spring Harb Perspect Med 8, (2018). - PMC - PubMed
    1. Ryan DP, Hong TS, Bardeesy N, Pancreatic adenocarcinoma. N Engl J Med 371, 2140–2141 (2014). - PubMed
    1. Cox AD, Der CJ, Ras history: The saga continues. Small GTPases 1, 2–27 (2010). - PMC - PubMed

Publication types

MeSH terms