. 2019 Jul 16;10(4):e01315-19.
doi: 10.1128/mBio.01315-19.

Crypt- and Mucosa-Associated Core Microbiotas in Humans and Their Alteration in Colon Cancer Patients

Affiliations

Crypt- and Mucosa-Associated Core Microbiotas in Humans and Their Alteration in Colon Cancer Patients

Azadeh Saffarian et al. mBio. .

Abstract

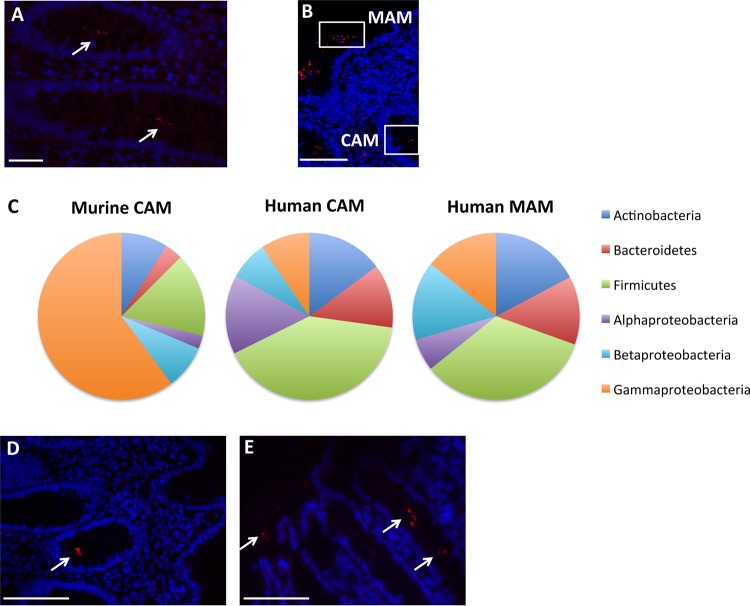
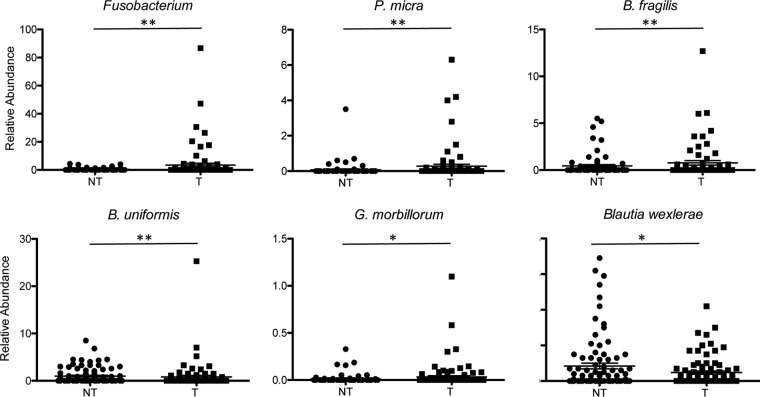
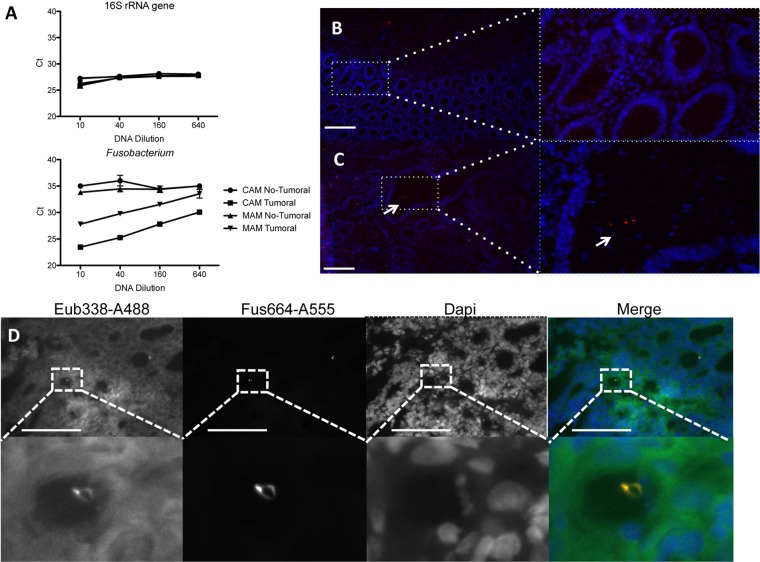
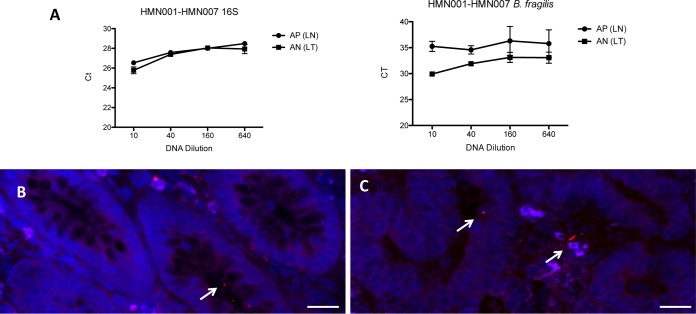
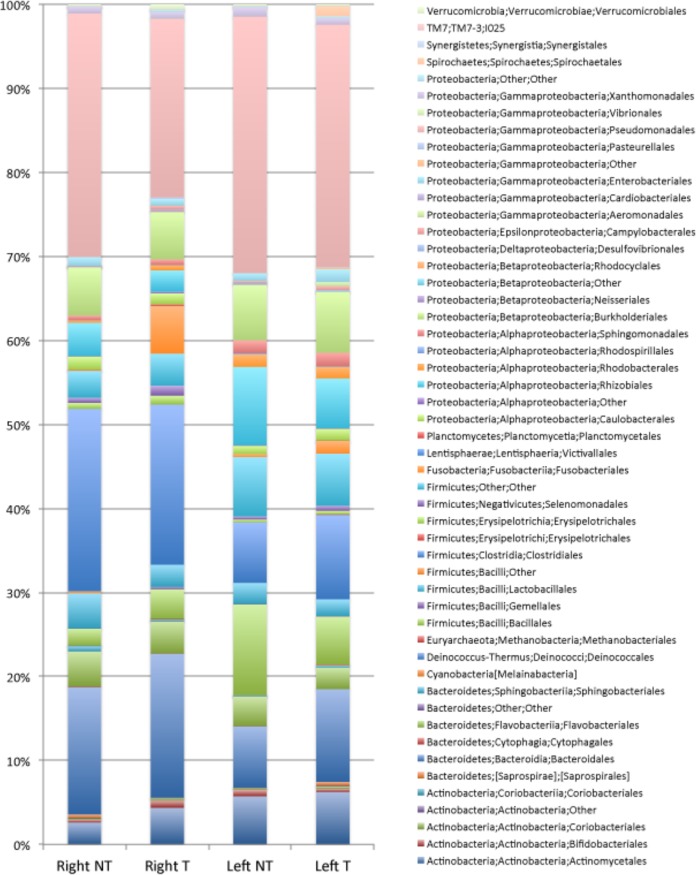
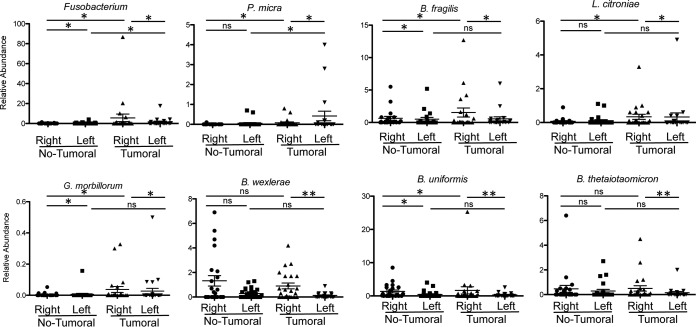
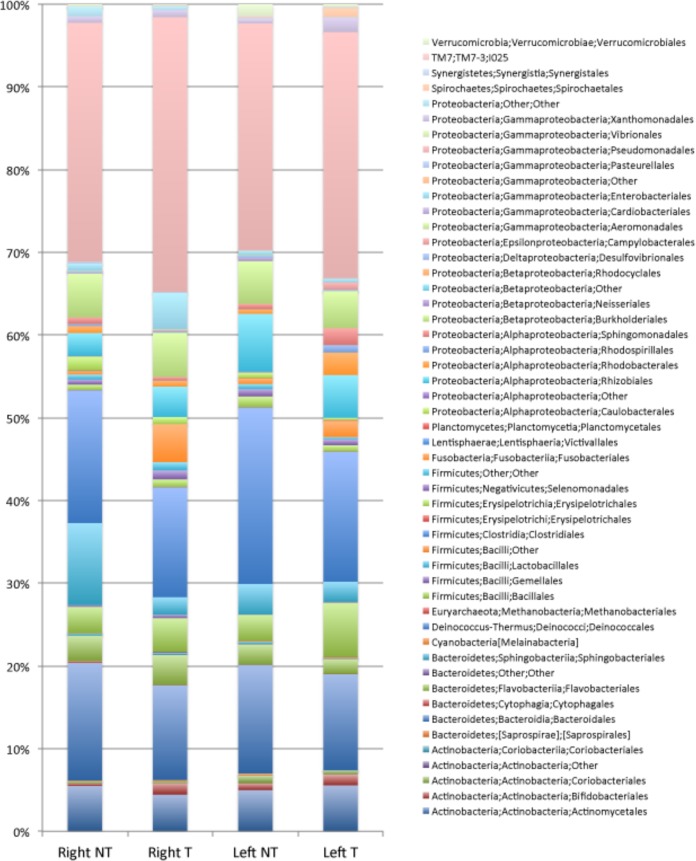
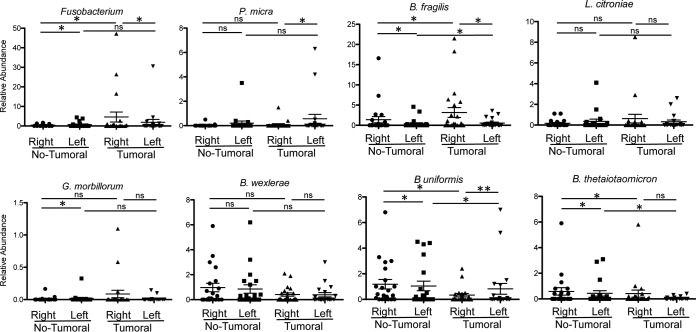
We have previously identified a crypt-specific core microbiota (CSCM) in the colons of healthy laboratory mice and related wild rodents. Here, we confirm that a CSCM also exists in the human colon and appears to be altered during colon cancer. The colonic microbiota is suggested to be involved in the development of colorectal cancer (CRC). Because the microbiota identified in fecal samples from CRC patients does not directly reflect the microbiota associated with tumor tissues themselves, we sought to characterize the bacterial communities from the crypts and associated adjacent mucosal surfaces of 58 patients (tumor and normal homologous tissue) and 9 controls with normal colonoscopy results. Here, we confirm that bacteria colonize human colonic crypts in both control and CRC tissues, and using laser-microdissected tissues and 16S rRNA gene sequencing, we further show that right and left crypt- and mucosa-associated bacterial communities are significantly different. In addition to Bacteroidetes and Firmicutes, and as with murine proximal colon crypts, environmental nonfermentative Proteobacteria are found in human colonic crypts. Fusobacterium and Bacteroides fragilis are more abundant in right-side tumors, whereas Parvimonas micra is more prevalent in left-side tumors. More precisely, Fusobacterium periodonticum is more abundant in crypts from cancerous samples in the right colon than in associated nontumoral samples from adjacent areas but not in left-side colonic samples. Future analysis of the interaction between these bacteria and the crypt epithelium, particularly intestinal stem cells, will allow deciphering of their possible oncogenic potential.IMPORTANCE Due to the huge number of bacteria constituting the human colon microbiota, alteration in the balance of its constitutive taxa (i.e., dysbiosis) is highly suspected of being involved in colorectal oncogenesis. Indeed, bacterial signatures in association with CRC have been described. These signatures may vary if bacteria are identified in feces or in association with tumor tissues. Here, we show that bacteria colonize human colonic crypts in tissues obtained from patients with CRC and with normal colonoscopy results. Aerobic nonfermentative Proteobacteria previously identified as constitutive of the crypt-specific core microbiota in murine colonic samples are similarly prevalent in human colonic crypts in combination with other anaerobic taxa. We also show that bacterial signatures characterizing the crypts of colonic tumors vary depending whether right-side or left-side tumors are analyzed.

Keywords: colon cancer; intestinal crypts; microbiota.


Figures

FIG 1
FIG 1
Microbiotas of control subjects. (A and B) Representative images from FISH analyses with the pan-bacterial probe Eub338 (red) of crypt-associated microbiota (CAM) (A) and mucosa-associated microbiota (MAM) (B) observed in normal colonic biopsy specimens. Panel B includes a representation of the CAM and MAM regions. (C) Average relative abundances at the phylum level in murine CAM and in human CAM and MAM. (D and E) Representative pictures from FISH analyses with the Acinetobacter-specific probe (red) of CAM (D) and MAM (E) in normal colonic biopsy specimens. White arrows indicate the presence of bacteria. Nuclei are counterstained with DAPI (blue). Scale bars: 20 μm (A) and 50 μm (B, D, and E).
FIG 2
FIG 2
Relative abundances of selected bacterial species in tumoral (T) and nontumoral (NT) samples. The percentages represent the sums of the relative abundances found in CAM and MAM. Data are displayed as means ± standard errors of the means (SEM) and were analyzed by the fitZIG test. *, P < 0.05; **, P < 0.01.
FIG 3
FIG 3
Validation of the presence of Fusobacterium in colonic tissues. The results of qPCR amplification of microdissected DNA are shown. (A) Amplification of microdissected samples using 16S rRNA genes or Fusobacterium primers. (B and C) Images are representative of FISH analyses with a Fusobacterium-specific probe linked to Alexa 555 of the homologous normal tissue (B) or the paired tumoral colonic tissue (C) of the same patient. (D) Representative images of FISH analyses with the pan-bacterial probe Eub338 (green) and the Fusobacterium-specific probe (red). Nuclei are stained in blue with DAPI. Scale bars: 100 μm (B and D) and 20 μm (C).
FIG 4
FIG 4
Validation of the presence of Bacteroides fragilis in colonic tissues. qPCR amplification of microdissected DNA is shown. (A) Amplification of microdissected samples using 16S rRNA genes or B. fragilis primers. AP and AN represent the LCM identification of samples from the nontumoral (LN) and tumoral (LT) MAM regions. (B and C) Images are representative of FISH analyses with a B. fragilis-specific probe linked to Alexa 555 of a noncancerous tissue (B) or the paired tumoral colonic tissue (C) of the same patient. Nuclei are counterstained in blue with DAPI. Scale bars: 20 μm.
FIG 5
FIG 5
Average relative abundances at the order level in CAM. Percentages are from the normal right colon (Right NT) or normal left colon (Left NT) and from the tumoral right colon (Right T) and tumoral left colon (Left T).
FIG 6
FIG 6
Relative abundances of selected bacterial species in crypt samples from the right colon and left colon from nontumoral and tumoral samples. Data are means ± SEM and were analyzed by the fitZIG test. *, P < 0.05; **, P < 0.01; ns, differences were not significant.
FIG 7
FIG 7
Average relative abundances at the order level in MAM. Percentages are from the normal right colon (Right NT) or normal left colon (Left NT) and from the tumoral right colon (Right T) and tumoral left colon (Left T).
FIG 8
FIG 8
Relative abundances of selected bacterial species in mucosa samples from the right colon and left colon from nontumoral and tumoral samples. Data are means ± SEM and were analyzed by the fitZIG test. *, P < 0.05; **, P < 0.01; ns, differences were not significant.

References

    1. Keku TO, Dulal S, Deveaux A, Jovov B, Han X. 2015. The gastrointestinal microbiota and colorectal cancer. Am J Physiol Gastrointest Liver Physiol 308:G351–G363. doi:10.1152/ajpgi.00360.2012. - DOI - PMC - PubMed
    1. Siegel RL, Miller KD, Fedewa SA, Ahnen DJ, Meester RGS, Barzi A, Jemal A. 2017. Colorectal cancer statistics, 2017. CA Cancer J Clin 67:177–193. doi:10.3322/caac.21395. - DOI - PubMed
    1. Sobhani I, Tap J, Roudot-Thoraval F, Roperch JP, Letulle S, Langella P, Corthier G, Tran Van Nhieu J, Furet JP. 2011. Microbial dysbiosis in colorectal cancer (CRC) patients. PLoS One 6:e16393. doi:10.1371/journal.pone.0016393. - DOI - PMC - PubMed
    1. Wang T, Cai G, Qiu Y, Fei N, Zhang M, Pang X, Jia W, Cai S, Zhao L. 2012. Structural segregation of gut microbiota between colorectal cancer patients and healthy volunteers. ISME J 6:320–329. doi:10.1038/ismej.2011.109. - DOI - PMC - PubMed
    1. Aries V, Crowther JS, Drasar BS, Hill MJ, Williams RE. 1969. Bacteria and the aetiology of cancer of the large bowel. Gut 10:334–335. doi:10.1136/gut.10.5.334. - DOI - PMC - PubMed

Publication types

MeSH terms

LinkOut - more resources