. 2019 Jul 16;10(1):3120.
doi: 10.1038/s41467-019-11049-4.

High-throughput targeted long-read single cell sequencing reveals the clonal and transcriptional landscape of lymphocytes

Affiliations

High-throughput targeted long-read single cell sequencing reveals the clonal and transcriptional landscape of lymphocytes

Mandeep Singh et al. Nat Commun. .

Abstract

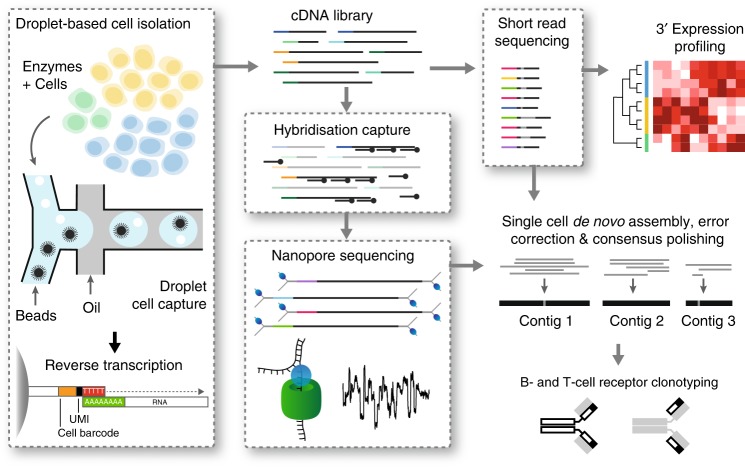
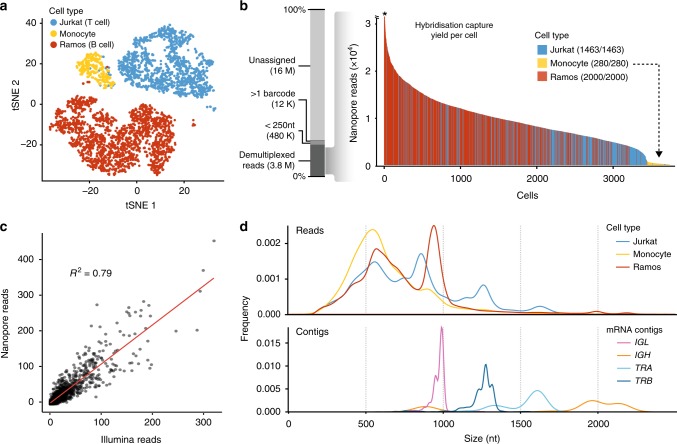
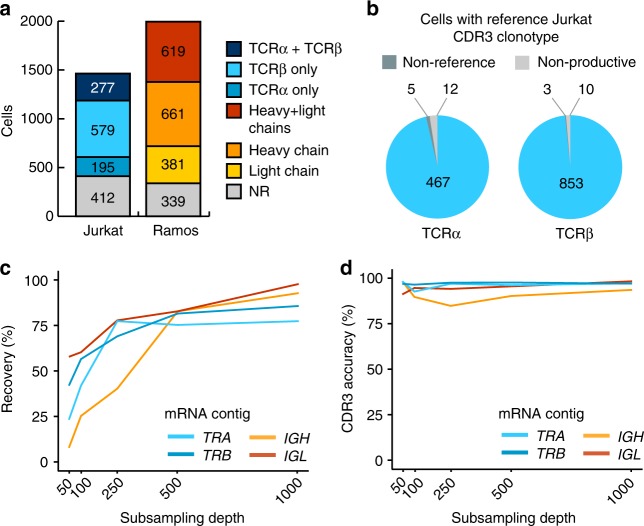
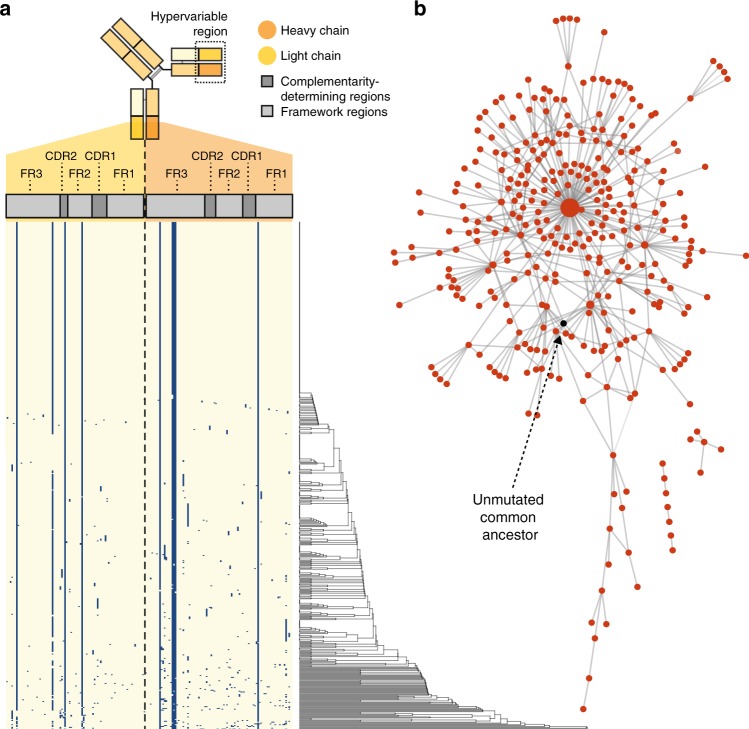
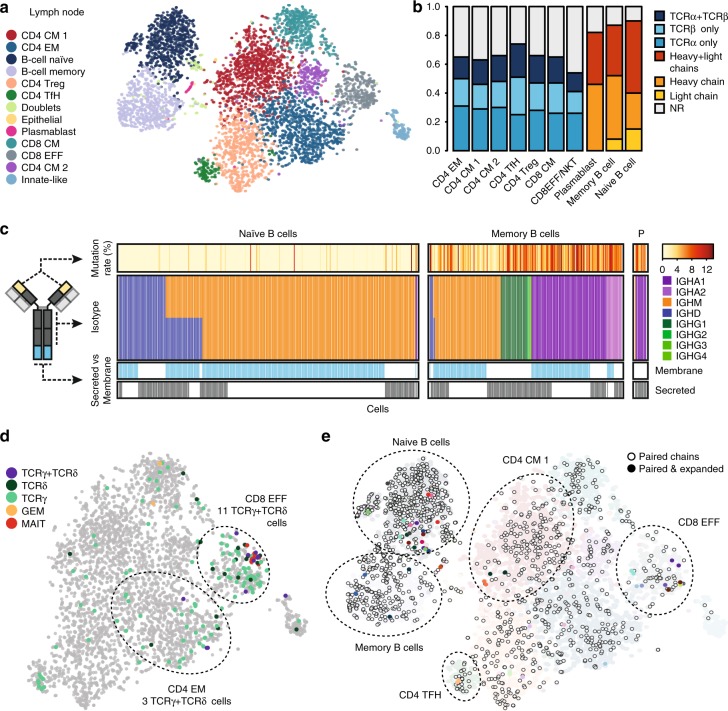
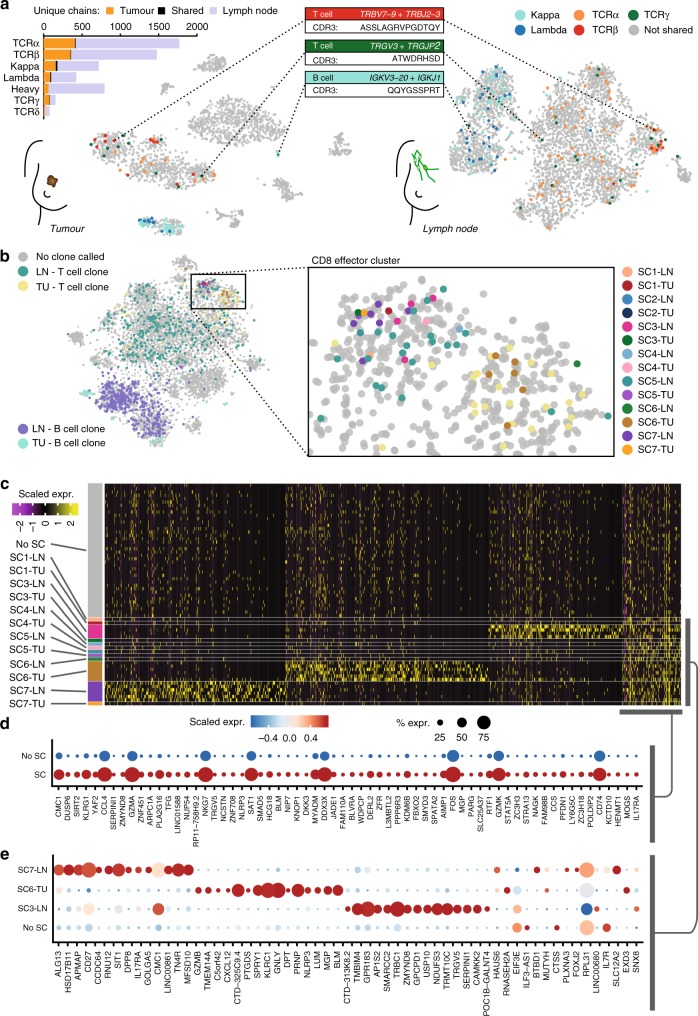
High-throughput single-cell RNA sequencing is a powerful technique but only generates short reads from one end of a cDNA template, limiting the reconstruction of highly diverse sequences such as antigen receptors. To overcome this limitation, we combined targeted capture and long-read sequencing of T-cell-receptor (TCR) and B-cell-receptor (BCR) mRNA transcripts with short-read transcriptome profiling of barcoded single-cell libraries generated by droplet-based partitioning. We show that Repertoire and Gene Expression by Sequencing (RAGE-Seq) can generate accurate full-length antigen receptor sequences at nucleotide resolution, infer B-cell clonal evolution and identify alternatively spliced BCR transcripts. We apply RAGE-Seq to 7138 cells sampled from the primary tumor and draining lymph node of a breast cancer patient to track transcriptome profiles of expanded lymphocyte clones across tissues. Our results demonstrate that RAGE-Seq is a powerful method for tracking the clonal evolution from large numbers of lymphocytes applicable to the study of immunity, autoimmunity and cancer.


Conflict of interest statement

M.S., G.A.A., C.C.G., S.L.C., J.M.F., K.J.L.J., M.A.S., and A.S. have filed a patent application covering some aspects of this work. The remaining authors declare no competing interests.

Figures

Fig. 1
Fig. 1
Overview of RAGE-Seq. Droplet-based scRNA-Seq is used to generate an initial barcoded cDNA library, which is split and simultaneously subjected to (i) short-read sequencing for 3’ expression profiling and (ii) targeted capture using custom probes followed by long-read sequencing. The short-read sequencing is used to generate highly accurate cell-barcode sequences which permit demultiplexing of the long-read data. Demultiplexed long-reads are subjected to de novo assembly and error correction to generate full-length BCR and TCR mRNA sequences, with single nucleotide accuracy. Transcriptome profiles generated from short-read sequencing can then be linked to the antigen–receptor sequence for each individual cell
Fig. 2
Fig. 2
Short-read and targeted long-read single cell sequencing of immortalised B and T cell lines. a T-distributed stochastic neighbour embedding (t-SNE) analysis of single cells generated from short-read sequencing data (number of cells: Jurkat = 1463; Ramos = 2000; monocytes = 280). b Demultiplexing statistics for nanopore sequencing reads following targeted capture. Each bar corresponds to the number of nanopore reads per cell barcode identified with short-read sequencing using exact sequence matching. Asterix indicates one cell with over 6000 reads. The number of recovered cell barcodes is shown next to each cell type. “ > 1 barcode” refers to more than one cell barcode found in a single read and “ < 250 nt” refers to any read shorter than 250 nt. c Correlation between Illumina read counts and Oxford Nanopore read counts for T-cell receptor alpha constant gene (TRAC). Each point represents an individual Jurkat cell (n = 472). Pearson correlation = 0.79. d Nanopore read length distribution of demultiplexed reads assigned to each cell type (top panel) compared to the length distribution of assembled contigs that have been assigned a productive receptor chain (bottom panel). Predicted lengths (nt) of mRNA transcripts: Jurkat TRA, 1552 nt; Jurkat TRB, 1,259 nt; Ramos IGH (secreted exons), 1485 nt, Ramos IGH (membrane exons), 1683 nt; Ramos IGL, 932 nt. Predicted lengths obtained from the IMGT database
Fig. 3
Fig. 3
Validation of antigen–receptor assembly. a Number of cells assigned productive TCRα and TCRβ chains for Jurkat cells (n = 1463) or productive heavy and light chains for Ramos cells (n = 2000). Only receptor chains expressing the reference V and J gene combinations of Jurkat (TRA: TRAV8-4, TRAJ3; TRB: TRBV12-3, and TRBJ1-2) or Ramos (IGH: VH4-34, IGHJ6; IGL: IGLV2-14, and IGLJ2) were assigned. NR no receptor. b CDR3 accuracy measured by the number of Jurkat cells with assigned TRA or TRB sequences that directly match the reference Jurkat CDR3 nucleotide sequences (Supplementary Fig. 2a). ‘Non-productive’ refers to a cell with a CDR3 sequence that is out-of-frame or contains stop-codons. ‘Non-reference’ refers to a cell with a productive CDR3 sequence that does not match the reference. Only cells with Jurkat reference V and J gene combinations were analysed. c Recovery of TCR and BCR chains as a function of sequencing depth. Subsampling was performed on exactly 200 Jurkat cells and 200 Ramos cells with >1000 nanopore reads and assigned paired receptor chains. For Ramos, cells with the most common IGH and IGL CDR3 sequence were pre-selected as the reference sequence (Supplementary Fig. 2a). Subsampling was performed at the indicated read depths on the X-axis. d Accuracy of the assembled CDR3 sequence as a function of sequencing depth, as described in c. The percentage of cells with a CDR3 sequence that matched the reference CDR3 sequence was measured at each subsampling depth
Fig. 4
Fig. 4
Tracking somatic hypermutation in an immortalized B-cell line. a Amino acid composition of the heavy and light chain V regions of individual Ramos cells assigned paired BCRs (n = 615). Each row represents an individual cell and each column a single amino acid position. Positions that are blue represent an amino acid that differs to the germline sequence, indicative of somatic hypermutation. On the right, a hierarchical clustering dendrogram of the concatenated heavy and light chain V region amino acid sequences is shown. b Network diagram of individual Ramos cells undergoing somatic hypermutation from a, where each node corresponds to a unique full-length heavy and light chain V(D)J sequence and the edges correspond to the number of amino acid differences between them. The largest node in the centre is the predominant sequence in the Ramos cell line represented by 147 cells. The unmutated common ancestor sequence in black was inferred from germline V(D)J sequences and is not represented by any cells in the dataset. Network diagram generated with Cytoscape
Fig. 5
Fig. 5
RAGE-Seq on a human lymph node. a t-SNE analysis of 6027 lymph node cells generated from short-read sequencing data. Number of cells: B-cell naive, 853; B-cell memory, 738; CD4 effector memory (EM), 1069; CD4 central memory (CM) 1, 1069; CD4 CM 2, 226; CD4 T follicular helper cell (TfH), 142; CD4 T regulatory cell (Treg), 740; CD8 CM, 487; CD8 effector (EFF), 405; Plasmablast, 28; Innate-like, 144; Doublets, 86; Epithelial, 13. b Assignment of productive TCR and BCR chains to each population identified in a. NR, no receptor. c Characterization of full-length IGH mRNA sequences assigned to individual naïve (n = 401) or memory B cells (n = 283) from the lymph node or plasmablasts (P, n = 15) from a matched tumor (Supplementary Fig. 6). Mutation rate (%) measures the percentage of nucleotides in the V region mutated from germline. d Assignment of TCRγ chains, TCRδ chains and invariant TCR chains associated with MAIT and GEM T cells to the T-cell populations of the lymph node in a. 92 T cells were assigned TCRγ chains alone, 14 T cells were assigned TCRδ chains alone and 11 T cells were assigned paired TCRγ and TCRδ chains. 10 T cells were assigned MAIT-associated TCR chains and two T cells assigned GEM-associated TCR chains (see Methods). e Visualisation of the lymph node t-SNE plot in a for cells assigned paired BCR (n = 689) or paired TCR (n = 705) chains and amongst these cells those clones that are expanded. Clones were considered expanded if a paired TCR or BCR sequence was found in more than one cell. Different colors denote each expanded clone. 13 T-cell expanded clones and 13 B-cell expanded clones were identified. Each clone was represented by two cells
Fig. 6
Fig. 6
Tracking lymphocytes across a matched lymph node and tumor. a t-SNE analysis of patient matched tumor (n = 2493, see Supplementary Fig. 6) and lymph node (see Fig. 5). Cells expressing a shared receptor chain sequence found in both the tumor and lymph node datasets are highlighted and grouped by receptor chain type. The most frequent TCRβ (n = 10), TCRγ (n = 13) and immunoglobulin light chain (n = 20) sequence is highlighted. b Integrated t-SNE analysis of tumor and lymph node datasets (see Methods, n = 8,520). Cells assigned paired TCR chains or paired immunoglobulin heavy chains are highlighted. Seven TCR chain sequences found in both tumor and lymph node datasets (single chains; SC) are shown (across n = 30 cells) and six (every clonotype except SC2) are found in the highlighted box containing the CD8 effector cluster of both lymph node and tumor datasets. c Heat-map of differentially expressed genes (n = 1,328; P < 0.01, Wilcoxon signed-rank test) within the CD8 effector cluster highlighted in b. 50 ‘non-shared cells’ were randomly chosen for visualisation purposes. d, e Dotplot illustrating the top 65 genes differentially expressed between d all shared clonotypes (SC) and non-shared clonotypes (No SC) or e the top three most frequent shared clonotypes (SC7, SC6, and SC3) and non-shared clonotypes. LN lymph node, TU tumor, SC shared clonotype

References

    1. Market E, Papavasiliou FN. V(D)J recombination and the evolution of the adaptive immune system. PLoS Biol. 2003;1:E16. doi: 10.1371/journal.pbio.0000016. - DOI - PMC - PubMed
    1. Wang ET, et al. Alternative isoform regulation in human tissue transcriptomes. Nature. 2008;456:470–476. doi: 10.1038/nature07509. - DOI - PMC - PubMed
    1. Bassing CH, Swat W, Alt FW. The mechanism and regulation of chromosomal V(D)J recombination. Cell. 2002;109(Suppl):S45–55. doi: 10.1016/S0092-8674(02)00675-X. - DOI - PubMed
    1. Chaudhuri J, Alt FW. Class-switch recombination: interplay of transcription, DNA deamination and DNA repair. Nat. Rev. Immunol. 2004;4:541–552. doi: 10.1038/nri1395. - DOI - PubMed
    1. Alt FW, et al. Synthesis of secreted and membrane-bound immunoglobulin mu heavy chains is directed by mRNAs that differ at their 3’ ends. Cell. 1980;20:293–301. doi: 10.1016/0092-8674(80)90615-7. - DOI - PubMed

Publication types

MeSH terms

Substances