. 2019 Jul 16;10(1):3126.
doi: 10.1038/s41467-019-11004-3.

Defective HNF4alpha-dependent gene expression as a driver of hepatocellular failure in alcoholic hepatitis

Affiliations

Defective HNF4alpha-dependent gene expression as a driver of hepatocellular failure in alcoholic hepatitis

Josepmaria Argemi et al. Nat Commun. .

Erratum in

  • Author Correction: Defective HNF4alpha-dependent gene expression as a driver of hepatocellular failure in alcoholic hepatitis.
    Argemi J, Latasa MU, Atkinson SR, Blokhin IO, Massey V, Gue JP, Cabezas J, Lozano JJ, Van Booven D, Bell A, Cao S, Vernetti LA, Arab JP, Ventura-Cots M, Edmunds LR, Fondevila C, Stärkel P, Dubuquoy L, Louvet A, Odena G, Gomez JL, Aragon T, Altamirano J, Caballeria J, Jurczak MJ, Taylor DL, Berasain C, Wahlestedt C, Monga SP, Morgan MY, Sancho-Bru P, Mathurin P, Furuya S, Lackner C, Rusyn I, Shah VH, Thursz MR, Mann J, Avila MA, Bataller R. Argemi J, et al. Nat Commun. 2023 Feb 10;14(1):757. doi: 10.1038/s41467-023-36548-3. Nat Commun. 2023. PMID: 36765087 Free PMC article. No abstract available.

Abstract

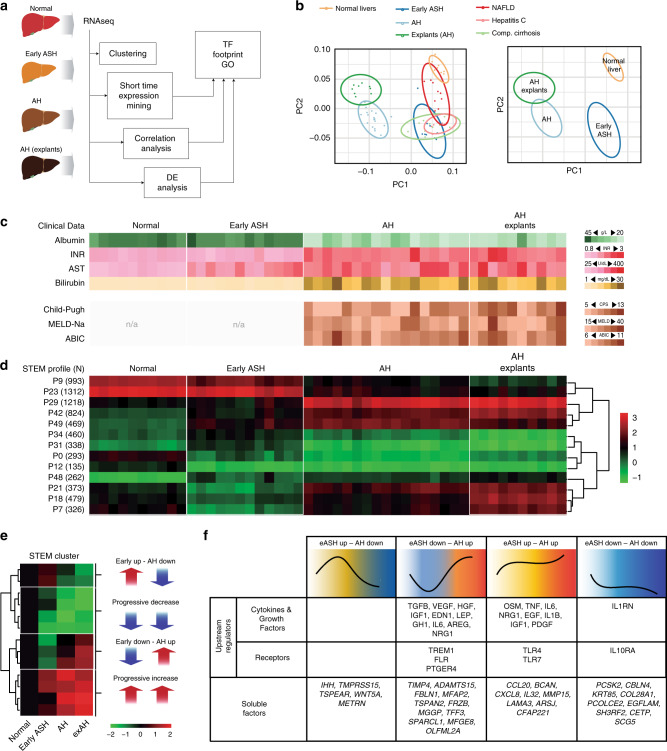
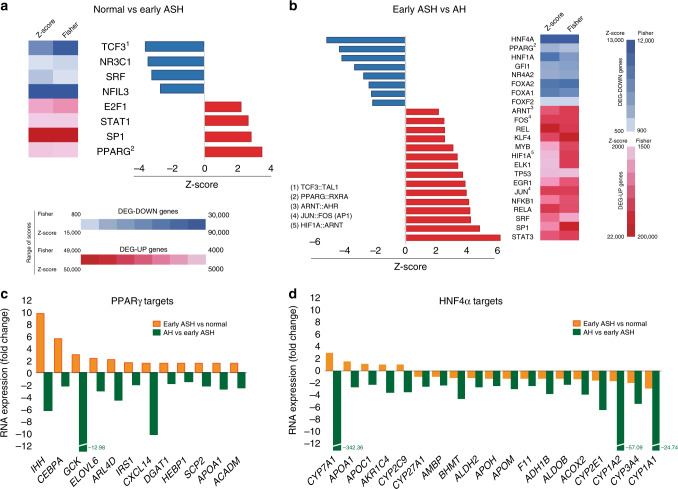
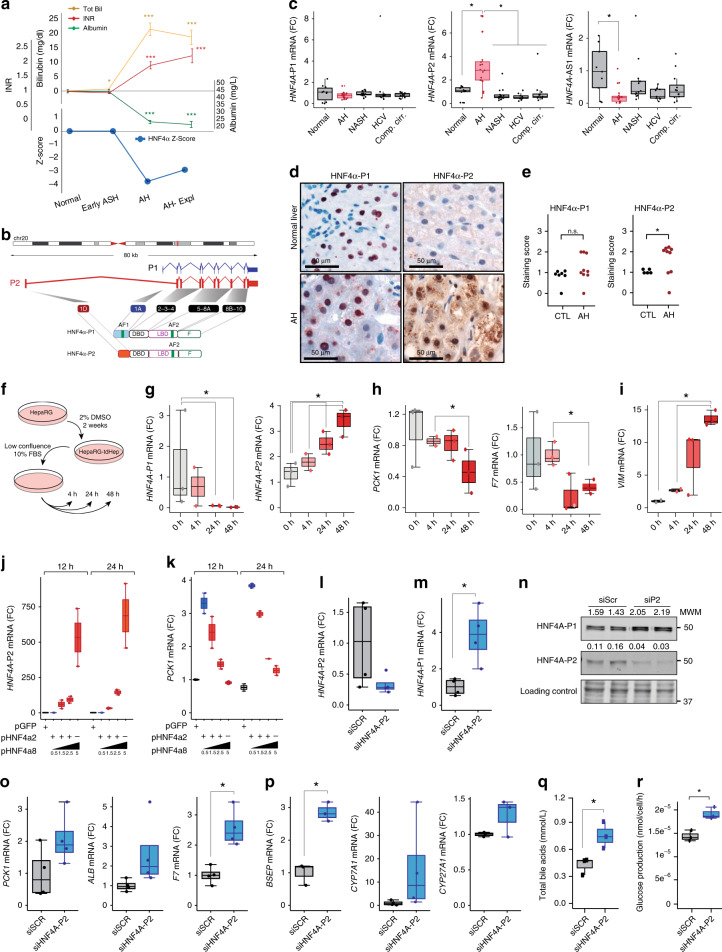
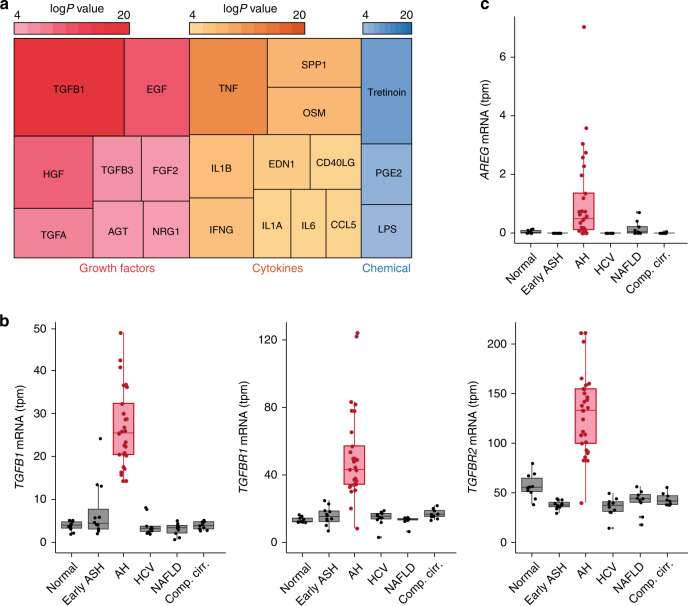
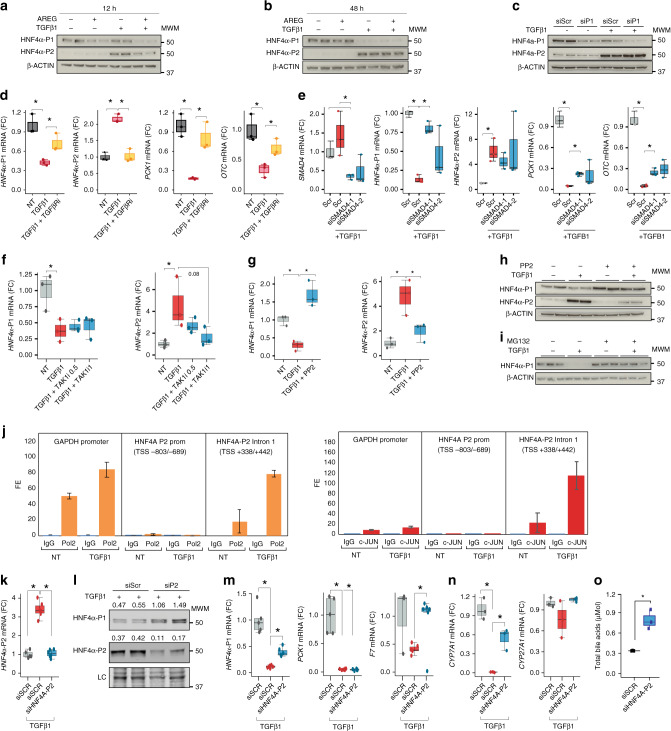
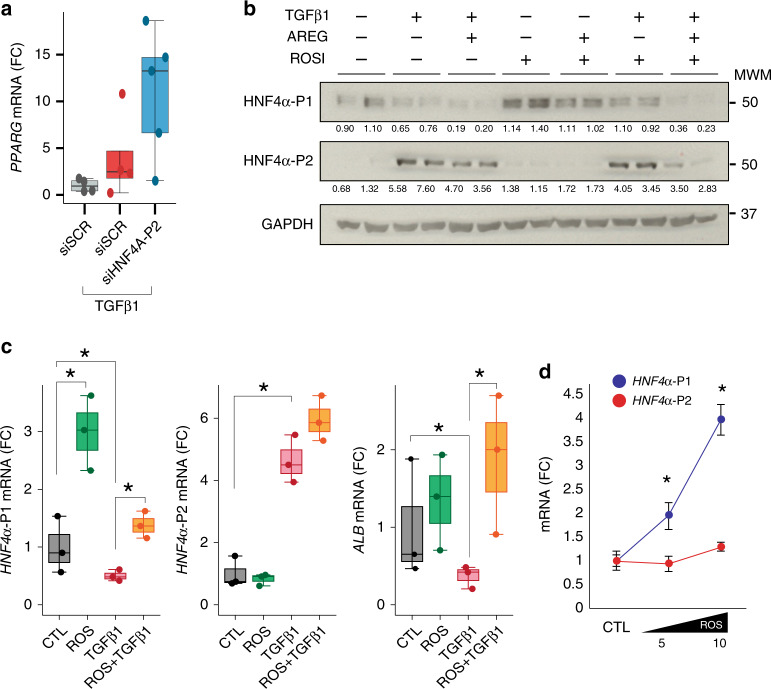
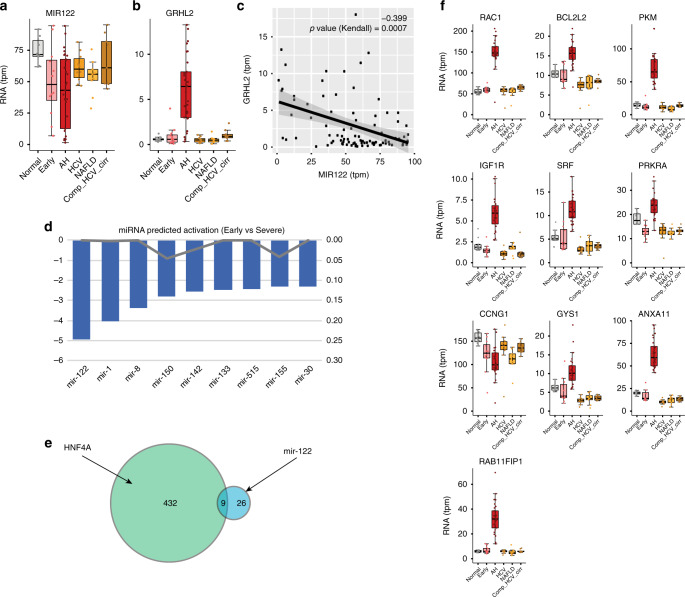
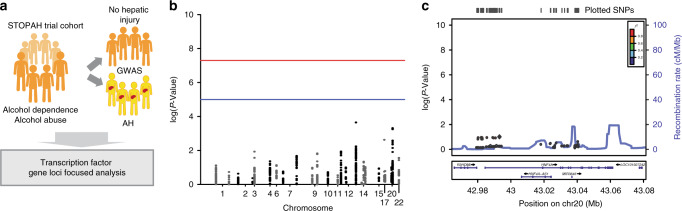
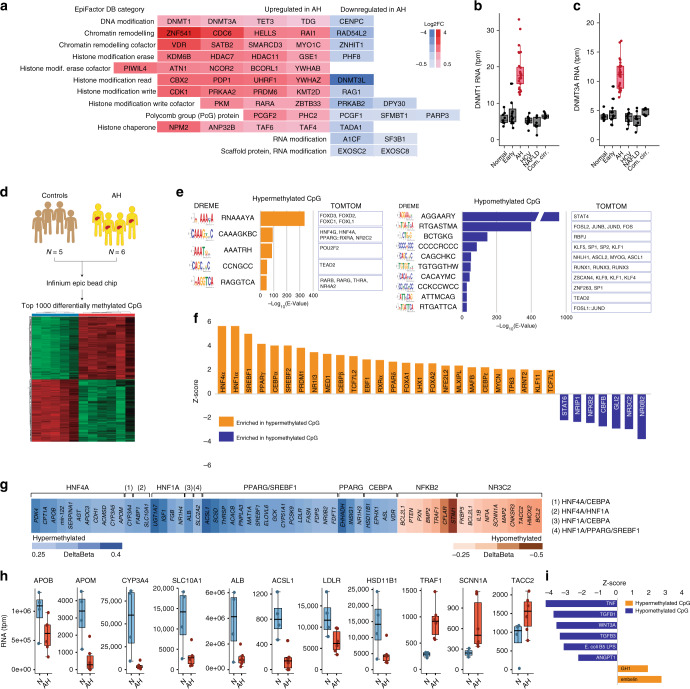
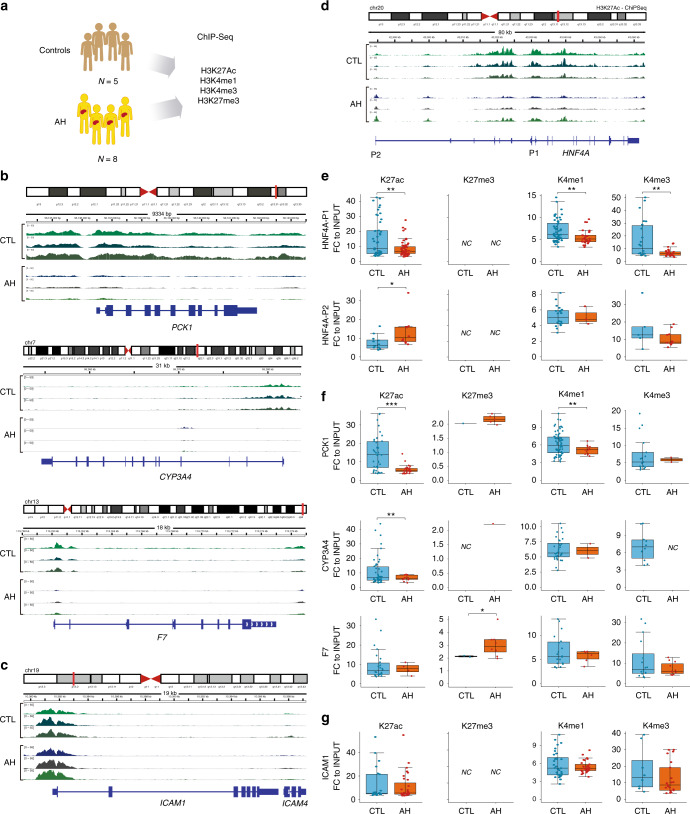
Alcoholic hepatitis (AH) is a life-threatening condition characterized by profound hepatocellular dysfunction for which targeted treatments are urgently needed. Identification of molecular drivers is hampered by the lack of suitable animal models. By performing RNA sequencing in livers from patients with different phenotypes of alcohol-related liver disease (ALD), we show that development of AH is characterized by defective activity of liver-enriched transcription factors (LETFs). TGFβ1 is a key upstream transcriptome regulator in AH and induces the use of HNF4α P2 promoter in hepatocytes, which results in defective metabolic and synthetic functions. Gene polymorphisms in LETFs including HNF4α are not associated with the development of AH. In contrast, epigenetic studies show that AH livers have profound changes in DNA methylation state and chromatin remodeling, affecting HNF4α-dependent gene expression. We conclude that targeting TGFβ1 and epigenetic drivers that modulate HNF4α-dependent gene expression could be beneficial to improve hepatocellular function in patients with AH.


Conflict of interest statement

The authors declare no competing interests.

Figures

Fig. 1
Fig. 1
Liver transcriptome encompasses disease progression in patients with ALD. a Human phenotypes included in the RNA-seq analysis: normal human livers (n = 10), early ASH (n = 12), AH (n = 18) and explants from AH patients (n = 11). Diseased controls: liver biopsies from patients with NAFLD (n = 9), non-cirrhotic HCV (n = 9) and compensated cirrhosis (n = 9). Unbiased clustering and Short Time Expression Miner (STEM) algorithm were used to group patients by RNA profiling and to identify main time-correlated patterns of expression. Kendall rank correlation coefficient and differential expression analysis (limma) between “Normal” and “Early ASH” and between “Early ASH” and “AH” groups was performed. Motif enrichment analysis (Opossum) and network analysis (Ingenuity Pathway Analysis) were used to identify main transcription factors involved in gene expression changes. b A schematic summary of Principal component analysis (PCA). c Heatmap of clinical and laboratory data of ALD patients: (Top) liver function tests: albumin serum levels, International Normalized Ratio (INR), aspartate aminotransferase (AST) and total serum bilirubin levels; (Bottom) Liver prognostic scores including Child-Pugh, MELD and ABIC; The color scale on the right indicates the range of each laboratory or clinical parameter. d Heatmap of STEM results, showing average expression (normalized log counts) of main groups of genes based on gene enrichment profile expression. Left column: STEM profile and number of genes. On top, patient phenotypes. Right panel, hierarchical clustering of profiles. See Supplementary Fig 2 for additional data from STEM analysis. e Heatmap of STEM results showing mean counts for all pattern-grouped genes for patients belonging to each disease stage. In the right panel, schematic representation (thick arrows) of main time-related expression patterns. f IPA analysis showing upstream regulators and soluble factors for each of four general expression pattern clusters. Regulators identified as cytokines, growth factors and receptors with a threshold ZS of 2 are presented (top-middle). Among the most 100 differentially expressed genes for each analysis, genes encoding secreted proteins are presented (bottom)
Fig. 2
Fig. 2
The predicted activity of liver-enriched transcription factors is defective in AH patients. a, b Transcription factor transcriptomic footprint inferred using Ingenuity Pathway Analysis (IPA) and Opossum analyses. Top differentially expressed (DE) genes between a normal livers and early ASH and b between early ASH and AH patients were the input for these analyses. Blue/Red indicates predicted activation/inhibition or motif enrichment in top 2000 downregulated/upregulated DE genes. c Selected target genes of PPARγ identified by IPA analysis. d Selected target genes of HNF4α identified by IPA analysis. Fold Changes (FC) in Normal vs Early ASH and between Early ASH and AH are presented. All genes in g and h had a FDR <10−6 in DE analysis
Fig. 3
Fig. 3
Fetal HNF4α-P2 isoform increase in patients with AH and its effect in HNF4α-P1. a Levels of bilirubin, INR and albumin levels in serum along ALD progression (values expressed as Mean  ±SEM) and HNF4α footprint Z-Score. b Scheme of HNF4A gene fetal (P2) and adult (P1) isoforms structure and protein variants. c Real-Time quantitative PCR (qPCR) of HNF4A-P1 and P2 dependent isoforms, and lncRNA HNF4A-AS1 in the cohort of patients in Fig. 1. d Immunohistochemical detection of adult and fetal HNF4A protein variants in patients with AH (n = 9), and controls (n = 9), using N-terminal specific antibodies. e Semi-quantitative assessment of IHC signal for each antibody for nuclear staining. f–i HepaRG cells were retro-differentiated into tumor-derived Hepatocyte-like cells (HepaRG-tdHep); de-differentiation was induced with FBS and RNA was extracted at 4, 24, and 48 h (n = 3 for each time point); qPCR of g HNF4α-P1 and P2 isoforms, h phosphoenol-pyruvate carboxy-kinase (PCK1), clotting Factor VII (F7) and i vimentin (VIM) j, k HepG2 cells were transfected with plasmids encoding P1 (HNF4α2) and P2 (HNF4α8) variants. P1 was maintained at same dose while P2 was increased as indicated. RNA was extracted 12 h and 24 h after transfection (n = 3); qPCR of j HNF4α-P2 isoform and k PCK1. l–p HepG2 cells were transfected with siRNA targeting the first exon (1E) of HNF4α-P2 isoforms (n = 3), and RNA and protein was extracted at 48 h after transfection. qPCR of l HNF4α-P2 and m HNF4α-P1. n Western blot of HNF4α-P1 and HNF4α-P2 in nuclear extracts. qPCR of HNF4α-P1 targets related to o metabolic functions (PCK1, ALB and F7) and p bile acid synthesis and transport (BSEP, CYP7A1 and CYP27A1). q, r Primary human hepatocytes were silenced with siRNA-HNF4A-P2. q Supernatant was collected 48 h after transfection (n = 3 for each group) and total bile acids were quantified. r Glucose production in P2-silenced primary human hepatocytes. Significance was determined by unpaired, two-tailed Student’s t-test in a and c, by Fisher exact probability test in d, e and by two-tailed Mann–Whitney U test in g, i, l, m, o, p, q, r: *P < 0.05. For box-and-whisker plots: perimeters, 25th–75th percentile; midline, median; individual data points are represented
Fig. 4
Fig. 4
TGFβ1 is the main upstream regulator of transcriptomic reprogramming in ALD. a Treemap of the top predicted activated growth factors, cytokines and chemicals as detected by IPA. Color and box areas are related to p-values, indicated in top-right color-scale. Most significant hits (P < 10−4) are shown. b, c mRNA abundance in transcripts per million (tpm) from normal livers, AH livers and livers of non-alcohol-related chronic disease of b TGFβ1, TGFβRI, and TGFβRII and c Amphiregulin (AREG). For box-and-whisker plots: perimeters, 25th–75th percentile; midline, median; whiskers, minimum to maximum values; individual data points are represented. Gene expression levels are presented in transcripts per million reads (tpm)
Fig. 5
Fig. 5
TGFβ1 induces the expression of HNF4α-P2 and binding by c-JUN to its promoter. a, b Immunoblots of HNF4α-P1 and HNF4α-P2 isoforms in Hep3B cells treated with TGFβ1 and or AREG (50 nM) for a 12 and b 48 h (n = 2). c Immunoblots of HNF4α-P1 and HNF4α-P2 from Hep3B cells transfected with an HNF4α-P1 specific siRNA for 48 h and treated with TGFβ1. d Hep3B cells were pre-treated with TGFβ-RI inhibitor SB431542 (5 nM) and treated with TGFβ1 (for 8 h (n = 3); qPCR of HNF4α-P1 and P2, PCK1 and Ornithine Carbamoyltransferase (OCT). e SMAD4-silenced Hep3B cells were treated overnight with TGFβ1; qPCR of SMAD4, HNF4α-P1 and P2 isoforms, PCK1 and OCT f Hep3B cells were pretreated with TAK1 inhibitor NG25 at 0.5 or 1 μM and then treated with TGFβ1 for 8 h (n= 3). qPCR of HNF4α-P1 and P2 isoforms. g Hep3B cells were treated with TGFβ1 overnight in the presence of cellular Src (c-Src) inhibitor PP2 (10 μM); g qPCR of HNF4α-P1 and P2 m Immunoblots of HNF4α-P1 and HNF4α-P2. k Chromatin immunoprecipitation of Hep3B cells treated with TGFβ1 overnight; RNA Polymerase II (orange), phospho-c-JUN (red) antibodies and normal mouse IgG (blue) were used. qPCR of GAPDH promoter, HNF4α-P2 promoter, and HNF4α-P2 proximal intron 1. Fold Enrichment of Pol II or c-JUN to control IgG is presented. l Hep3B cells were treated with TGFβ1 for 24 h and with the addition of proteasome inhibitor MG132 (10 μM) 2 h before collection when indicated (n= 3); immunoblot of HNF4α-P1. or HNF4α-P2-silenced HepG2 cells were collected 8 h (RNA) or 24 h (Nuclei) after TGFβ1 treatment (5 ng/ml) (n = 4–6); o qPCR of HNF4α-P2; p immunoblot of nuclear HNF4α-P1 and P2 isoforms q qPCR of HNF4α-P1 target genes PCK1, ALB, F7 and r CYP7A1 and CYP27A1. s Primary human hepatocytes were silenced with siRNA-HNF4α-P2 and supernatant was collected 48 h after transfection and 8 h after TGFβ1 treatment. Total bile acids in supernatant were quantified (n= 3). Significance was determined by two-tailed Mann–Whitney U test in d, e, g, k, m, n, o *P < 0.05. For box-and-whisker plots: perimeters, 25th–75th percentile; midline, median. The TGFβ1 dose used was 5 ng/ml
Fig. 6
Fig. 6
PPARγ agonist Rosiglitazone partially restores TGFB1-induced HNF4A de-regulation. a HepG2 cells were transfected with HNF4α-P2 siRNA for 48 h and collected 8 h after TGFβ1 treatment (5 ng/ml) (n = 5 for each condition);qPCR of PPARγ. b, c Hep3B cells were pretreated with rosiglitazone (10 μM) overnight and then treated with TGFβ1 (5 ng/ml) and/or AREG (50 nM) for 8 h (n = 3 for each condition); b Immunoblot of HNF4α-P1 and HNF4α-P2 c qPCR of HNF4α-P1 and P2 isoforms and ALB. d Hep3B cells were treated with rosiglitazone at doses of 5 and 10 μM, and harvested 16 h after treatment; qPCR of HNF4α-P1 and P2 isoforms (n = 3 for each condition). Significance was determined by two-tailed Mann–Whitney U test in a, b and d: *P < 0.05. For box-and-whisker plots: perimeters, 25th–75th percentile; midline, median
Fig. 7
Fig. 7
miR122 levels and miR122 predicted downregulation in AH patients. a RNA levels of hpri-miR122 in our cohort b levels of Grainyhead Like Transcription Factor 2 (GRHL2) in our cohort c correlation of GRH2L2 and MIR122 levels. R and p value (Kendall) are presented. d Results of miRNA predicted activity by means of IPA Upstream Regulator analysis when comparing early ASH vs AH. Top 8 miRNA are presented. e Venn diagram of the overlap between HNF4A and MIR122 targets among the differentially expressed genes in the comparison between early ASH and AH. f Box plot of most 10 validated miR122 targets (miRTarBase database) in our cohort. Box-and-whisker plots indicate 25th–75th percentile; midline, median; whiskers, minimum to maximum values; individual data points are represented. In bold, those genes that reached FDR < 10−6 level of significance in DESeq2 differential expression analysis between early ASH and AH. For box-and-whisker plots: perimeters, 25th–75th percentile; midline, median. Gene expression levels are presented in transcripts per million reads (tpm)
Fig. 8
Fig. 8
GWAS study does not show an association of LETF SNPs with the development of AH. a Detection of single nucleotide polymorphisms (SNP) associated to AH in transcription factor gene loci. In this study we compared patients had alcohol dependence but with no evidence of liver injury (n = 318) and patients with alcohol dependence and biopsy-proven severe AH (n = 332). b Manhattan plot of all the SNP present in the selected genomic regions (see also Supplementary Data 3). c LocusZoom plot of HNF4A locus
Fig. 9
Fig. 9
DNA hypermethylation of HNF4α-targets in AH patients. a Heatmap of Log Fold Changes in the expression of main epigenetic modulators in AH patients. Genes are organized by the 12 family of factors described in EpiFactor Database. b, c mRNA abundance in transcripts per million (tpm) from normal livers, AH livers and livers of non-alcohol-related chronic disease of b DNA Methyl-Transferases DNMT1 and c DNMT3A. d–i DNA extracted from 5 Normal and 6 AH livers was bisulfite treated and hybridized in Illumina Infinium MethylationEPIC chip. d heatmap of top 2000 hyper or hypomethylated CpG islands. e DREME and TomTom algorithms (MEME-ChIP suite) were used to search for de novo transcription factor binding sites (tfbs) in hyper and hypomethylated regions and to identify transcription factors known to match these tfbs, respectively. f Differentially methylated regions were gene annotated (nearest-feature) and Ingenuity Pathway Analysis (IPA) was used to predict which transcription factor are predicted to be an upstream regulator genes with DM CpGs. Intensity of the enrichment is presented as Z-Score (p < 0.01). g Selected TF target genes delta-β changes: values are expressed with blue-color gradient if hypermethylated and brown-color if hypomethylated. h RNA sequencing of the same samples used in methylation chip was used to validate potential functional impact of hyper/hypomethylation on gene expression. i IPA analysis of soluble factors upstream the hyper and the hypomethylated region. Intensity of the enrichment is presented as Z-Score. For box-and-whisker plots in b, c, h: perimeters, 25th–75th percentile; midline, median. Gene expression levels are presented in transcripts per million reads (tpm)
Fig. 10
Fig. 10
ChIP-seq shows decreased H3K27Ac and H3K4me1 in HNF4α-P1 and its targets and enhanced binding of H3K27Ac to HNF4α P2 promoter. a Data were obtained from ChIP-seq of Human Liver samples from normal (n = 5) and AH (n = 6) livers. Antibodies agains Histone 3 Lysine 27 acetylation (H3K27Ac), Histone 3 Lysine 4 mono and trimethylation (H3K4me1 and H3K4me3) and Histone 3 Lysine 27 trimethylation (H3K27me3) were used in the immunoprecipitation. Integrated Genome Viewer was used to visualize BigWig peak data. bd Genomic view of sequencing reads present in loci of b HNF4α targets PCK1, CYP3A4 and F7, c Non-HNF4α target ICAM-1 and d HNF4A. eg Box plot of fold changes (IP to Input) of all peaks called around the TSS of e HNF4A isoforms P1 and P2, f HNF4A targets PCK1, CYP3A4 and F7 and g ICAM1. Significance was determined by two-tailed Student t test in e, f, and g: *P < 0.05, **P < 0.01, ***P < 0.001. For box-and-whisker plots in e, f, g: perimeters, 25th–75th percentile; midline, median

References

    1. Leon DA, McCambridge J. Liver cirrhosis mortality rates in Britain from 1950 to 2002: an analysis of routine data. Lancet. 2006;367:52–56. doi: 10.1016/S0140-6736(06)67924-5. - DOI - PubMed
    1. Williams R, et al. Addressing liver disease in the UK: a blueprint for attaining excellence in health care and reducing premature mortality from lifestyle issues of excess consumption of alcohol, obesity, and viral hepatitis. Lancet. 2014;384:1953–1997. doi: 10.1016/S0140-6736(14)61838-9. - DOI - PubMed
    1. Case A, Deaton A. Rising morbidity and mortality in midlife among white non-Hispanic Americans in the 21st century. Proc. Natl Acad. Sci. USA. 2015;112:15078–15083. doi: 10.1073/pnas.1518393112. - DOI - PMC - PubMed
    1. Gao B, Bataller R. Alcoholic liver disease: pathogenesis and new therapeutic targets. Gastroenterology. 2011;141:1572–1585. doi: 10.1053/j.gastro.2011.09.002. - DOI - PMC - PubMed
    1. Mellinger Jessica L., Shedden Kerby, Winder Gerald Scott, Tapper Elliot, Adams Megan, Fontana Robert J, Volk Michael L., Blow Frederic C., Lok Anna S.F. The high burden of alcoholic cirrhosis in privately insured persons in the United States. Hepatology. 2018;68(3):872–882. doi: 10.1002/hep.29887. - DOI - PubMed

Publication types

MeSH terms

Substances