. 2019 Jul 16;9(1):10263.
doi: 10.1038/s41598-019-46753-0.

Atrogin-1/MAFbx mRNA expression is regulated by histone deacetylase 1 in rat soleus muscle under hindlimb unloading

Affiliations

Atrogin-1/MAFbx mRNA expression is regulated by histone deacetylase 1 in rat soleus muscle under hindlimb unloading

Ekaterina P Mochalova et al. Sci Rep. .

Abstract

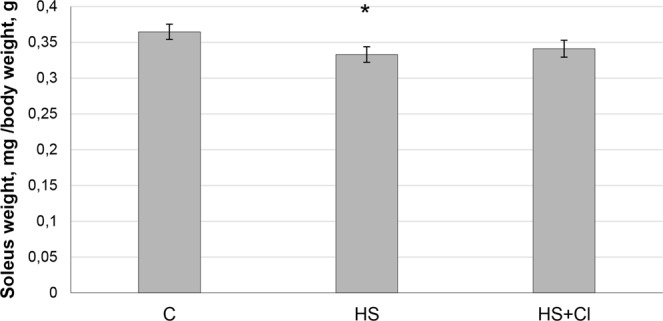
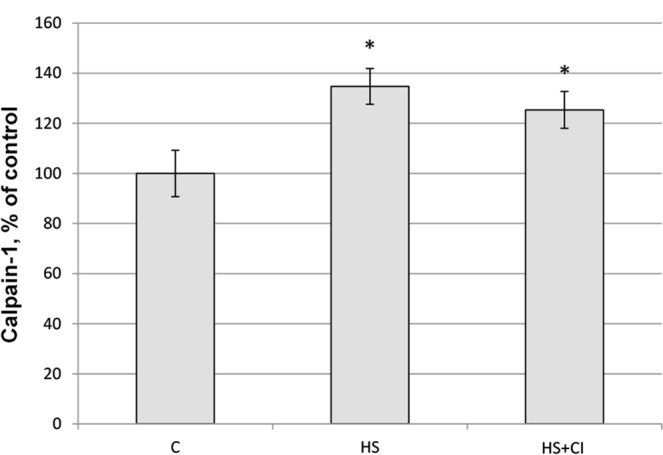
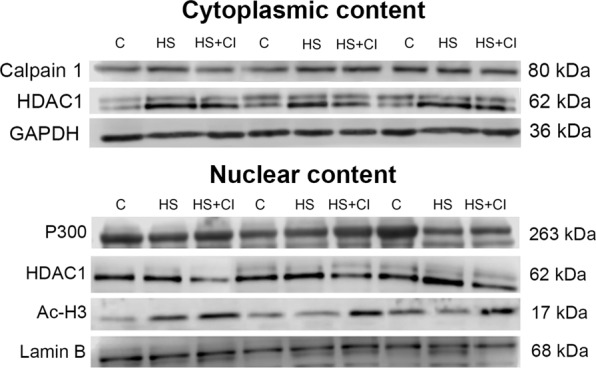
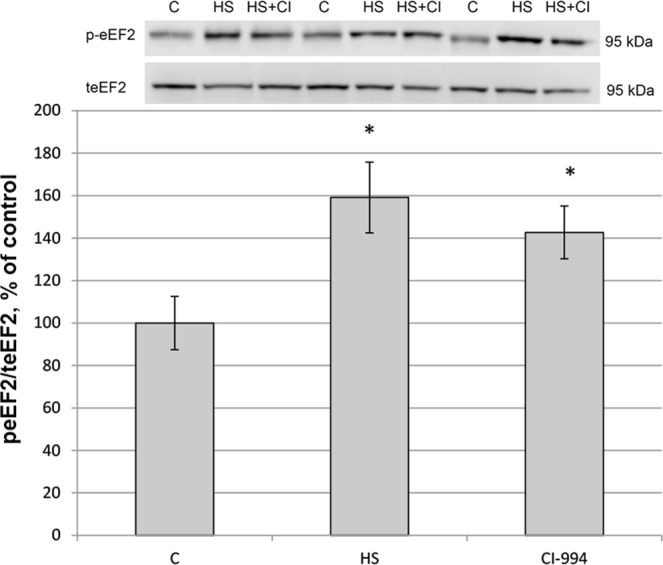
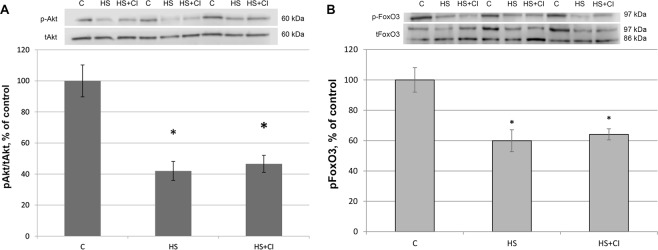
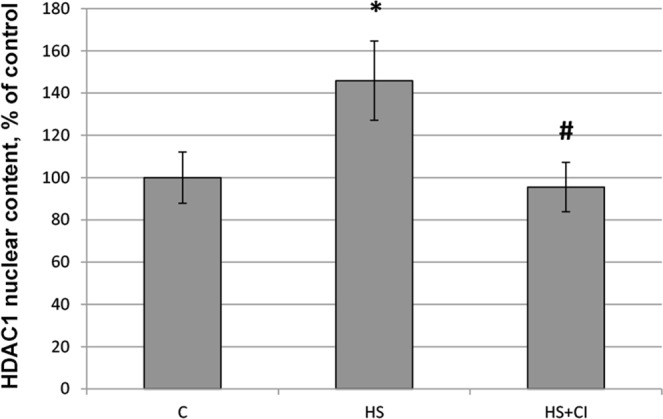
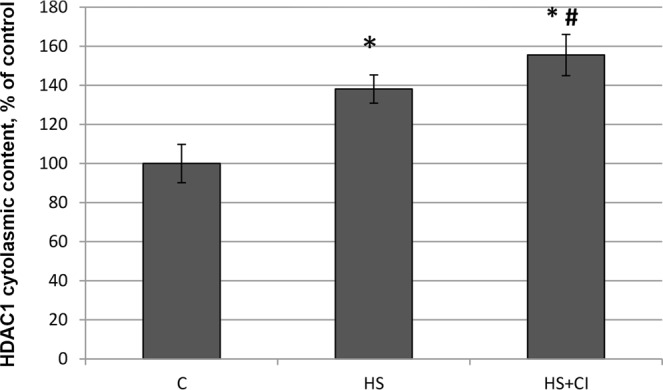
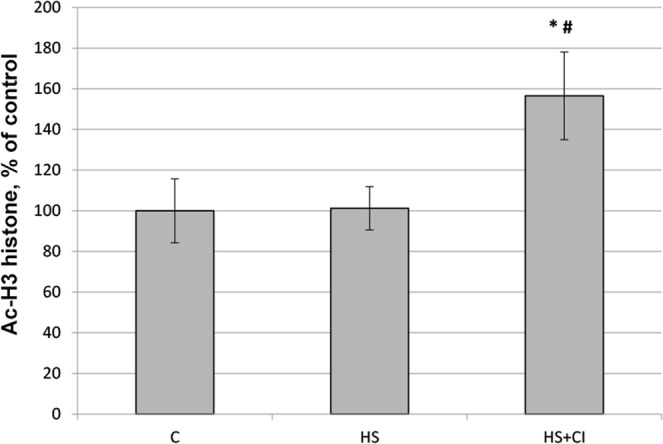
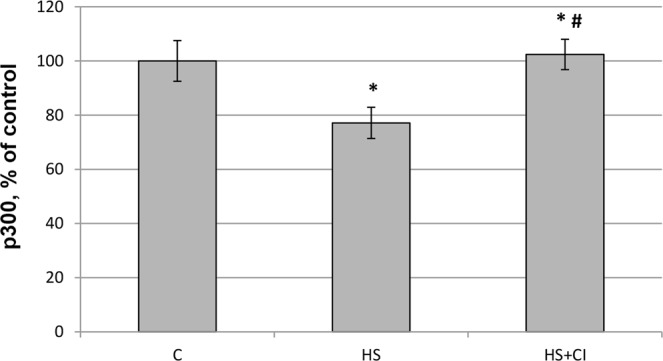
It is known that MuRF-1 and atrogin-1/MAFbx mRNA expression is increased in rat soleus muscle under unloading conditions. We aimed to determine the role of histone deacetylase 1 (HDAC1) in the activation of MuRF-1 and MAFbx expression in rat soleus muscle at the early stage of hindlimb suspension (HS). To this end, male Wistar rats (195-215 g) were divided into 3 groups (n = 8/group): control (C), 3-day HS (HS) and 3-day HS + HDAC1 inhibitor CI-994 (1 mg/kg/day) (HS + CI). Protein content and mRNA expression levels of regulatory molecules were determined by Western-blotting and RT-PCR. CI-994 treatment prevented HS-induced increase in HDAC1 nuclear content. As expected, 3-day HS induced a significant upregulation in MAFbx, MuRF-1 and ubiquitin. CI-994 administration resulted in an attenuation of HS-mediated increase in MAFbx and ubiquitin expression levels but did not affect MuRF-1 expression. A decrease in histone acetyltransferase p300 nuclear content in the HS group was prevented by CI-994 administration. There were no significant differences in the content of phosphorylated anabolic signaling molecules between HS group and HS + CI group. Thus, inhibition of HDAC1 prevented a HS-mediated increase in MAFbx and ubiquitin expression, but did not affect MuRF-1 gene expression.


Conflict of interest statement

The authors declare no competing interests.

Figures

Figure 1
Figure 1
Soleus weight-to-body weight ratio. С – control, HS – 3-day hindlimb suspension + placebo, HS + CI – 3-day hindlimb suspension + CI-994 (HDAC1 inhibitor). All values are means ± SE, n = 8/group. *significant difference from control (p < 0.05).
Figure 2
Figure 2
The content of calpain-1 in rat soleus muscle. С – control, HS – 3-day hindlimb suspension + placebo, HS + CI – 3-day hindlimb suspension + CI-994 (HDAC1 inhibitor). All values are means ± SE, n = 8/group. *significant difference from control (p < 0.05).
Figure 3
Figure 3
Representative western blots for Calpain-1, HDAC1, P300, Ac-H3, GAPDH and Lamin B in cytoplasmic and nuclear fractions.
Figure 4
Figure 4
The level of eEF2 phosphorylation in rat soleus muscle. С – control, HS – 3-day hindlimb suspension + placebo, HS + CI – 3-day hindlimb suspension + CI-994 (HDAC1 inhibitor). All values are means ± SE, n = 8/group. *significant difference from control (p < 0.05).
Figure 5
Figure 5
The content of phosphorylated Akt (S473) (A) and FoxO3 (S253) (B) in rat soleus muscle. С –control, HS – 3-day hindlimb suspension + placebo, HS + CI – 3-day hindlimb suspension + CI-994 (HDAC1 inhibitor). All values are means ± SE, n = 8/group. *significant difference from control (p < 0.05).
Figure 6
Figure 6
Nuclear content of HDAC1 in rat soleus muscle. С – control, HS – 3-day hindlimb suspension + placebo, HS + CI – 3-day hindlimb suspension + CI-994 (HDAC1 inhibitor). All values are means ± SE, n = 8/group. *significant difference from control (p < 0.05), #significant difference from the HS group (p < 0.05).
Figure 7
Figure 7
Cytoplasmic content of  HDAC1 in rat soleus muscle. С – control, HS – 3-day hindlimb suspension + placebo, HS + CI – 3-day hindlimb suspension + CI-994 (HDAC1 inhibitor). All values are means ± SE, n = 8/group. *significant difference from control (p < 0.05), #significant difference from the HS group (p < 0.05).
Figure 8
Figure 8
Nuclear content of Ac-H3 in rat soleus muscle. С – control, HS – 3-day hindlimb suspension + placebo, HS + CI – 3-day hindlimb suspension + CI-994 (HDAC1 inhibitor). All values are means ± SE, n = 8/group. *significant difference from control (p < 0.05), #significant difference from the HS group (p < 0.05).
Figure 9
Figure 9
Nuclear content of histone acetyltransferase p300 in rat soleus muscle. С – control, HS – 3-day hindlimb suspension + placebo, HS + CI – 3-day hindlimb suspension + CI-994 (HDAC1 inhibitor). All values are means ± SE, n = 8/group. *significant difference from control (p < 0.05), #significant difference from the HS group (p < 0.05).

References

    1. Bodine SC, Baehr LM. Skeletal muscle atrophy and the E3 ubiquitin ligases MuRF1 and MAFbx/atrogin-1. Am. J. Phys. End. Metab. 2014;307:469–484. - PMC - PubMed
    1. Glass DJ. Signalling pathways that mediate skeletal muscle hypertrophy and atrophy. Nat. Cell Biol. 2003;5:87–90. doi: 10.1038/ncb0203-87. - DOI - PubMed
    1. Glass DJ. Skeletal muscle hypertrophy and atrophy signaling pathways. Int. J. Biochem. Cell Biol. 2005;37:1974–1984. doi: 10.1016/j.biocel.2005.04.018. - DOI - PubMed
    1. Jackman RW, Kandarian SC. The molecular basis of skeletal muscle atrophy. Am. J. Physiol. Cell Physiol. 2004;287:834–43. doi: 10.1152/ajpcell.00579.2003. - DOI - PubMed
    1. Cohen S, et al. During muscle atrophy, thick, but not thin, filament components are degraded by MuRF1-dependent ubiquitylation. J. Cell Biol. 2009;185:1083–95. doi: 10.1083/jcb.200901052. - DOI - PMC - PubMed

Publication types