. 2019 Sep;12(5):1118-1129.
doi: 10.1038/s41385-019-0186-9. Epub 2019 Jul 16.

A pro-inflammatory CD8+ T-cell subset patrols the cervicovaginal tract

Affiliations

A pro-inflammatory CD8+ T-cell subset patrols the cervicovaginal tract

Laura Pattacini et al. Mucosal Immunol. 2019 Sep.

Abstract

The immune system of the cervicovaginal tract (CVT) must balance immunosurveillance and active immunity against pathogens with maintenance of tolerance to resident microbiota and to fetal and partner antigens for reproductive purposes. Thus, we predicted that CVT immunity is characterized by distinctive features compared to blood and other tissue compartments. Indeed, we found that CVT CD8+ T-cells had unique transcriptional profiles, particularly in their cytokine signature, compared to that reported for CD8+ T-cells in other tissue sites. Among these CVT CD8+ T-cells, we identified a CD69- CD103- subset that was characterized by reduced migration in response to tissue-exit signals and higher pro-inflammatory potential as compared to their blood counterpart. These inflammatory mucosal CD8+ T-cells (Tim) were increased in frequency in the CVT of individuals with chronic infection, pointing to a potential role in perpetuating inflammation. Our findings highlight the specialized nature of immunity within the CVT and identify Tim cells as potential therapeutic targets to tame tissue inflammation upon chronic infection.


Conflict of interest statement

Disclosure

The authors declare no conflicts of interest.

Figures
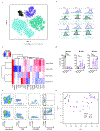
Figure 1.
Figure 1.. CD8+ T-cells in the blood versus the CVT show phenotypical and transcriptional differences.
A) Dimensionality reduction of multiple parameters measured by flow cytometric staining in CVT tissues and blood was visualized by a t-SNE plot. Representative histograms (B) and protein expression (determined by flow cytometric staining) heat map (C) show that CD4+ and CD8+ T-cells in the CVT express high levels of CD69, CD103, CD49a, PD-1, CD101 and CCR5. D) Mean frequencies (± SD) of DN, CD69+ and DP cells in blood (black), endocervix (pink), ectocervix (purple) and vaginal tissue (dark purple). Statistical significance was determined by Ordinary one-way ANOVA with Tukey’s multiple comparisons test. n=7, *p<0.05, **p<0.01, ***p<0.001 and ****p<0.0001. E) Gating scheme used for sorting cells in blood (upper panel) and tissues (lower panel). (F) MDS plot of RNA sequencing data from CD69+CD103+ (DP; triangles), CD69+CD103- (SP; circles), and CD69-CD103- (DN; squares) CD8+ T-cells sorted from the ectocervix, endocervix, blood, or vagina.
Figure 2.
Figure 2.. T-cells in the endocervix, ectocervix and vaginal tissue display similar phenotypes and transcription patterns.
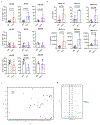
A) Mean frequencies (± SD) of CD4+ and CD8+ T-cells expressed as percentages of CD3+ CD45+ live cells in endocervical (EndoCx), ectocervical (EctoCx) and vaginal tissue (VT) were determined by flow cytometric staining. B) Mean frequencies (± SD) of naïve (CCR7+ CD45RA+), activated (CD127dim CD25+), effector memory (Tem, CCR7-) and central memory (Tcm, CCR7+ CD45RA-) CD8+ T-cells in the 3 CVT tissues. C) Mean frequencies (± SD) of CCR5, CXCR3, CD49a, and PD-1 as percentages of DN (top), CD69+ (middle) and CD69+CD103+ DP (bottom) T-cells for EndoCx, EctoCx and VT. n = 5. To test for statistical significance, a Kruskal-Wallis test was performed with Dunn’s multiple comparisons test. D) Heatmap showing the RNA expression patterns of DP, SP, and DN CD8+ T-cells within the blood and the three types of CVT tissues.
Figure 3.
Figure 3.. DN cells in the tissue differ from those in the blood and show a characteristic migration and inflammatory pattern.
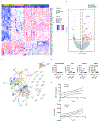
A) Heat map showing the RNA expression pattern of CD8+ T-cells for a set of genes differentially expressed in blood DN versus tissue DP cells. B) Volcano plot of genes differentially expressed in CVT tissue DN versus blood DN CD8+ T-cells (red = upregulated, blue=downregulated genes). C) Pathways enriched in the gene set upregulated in tissue DN versus blood DN. (Red= cell migration pathway, purple=inflammatory pathway, green = localization pathway). D) The mean frequencies (± SD) of migrated cells as percentages of non-migrated cell in response to S1P, CCL19 and CCL21. Statistical significance was determined by unpaired t-test. n=3 donors, *p<0.05, **p<0.01. E) Pearson correlations between the frequencies of DN cells in the vagina and the concentrations of MIP-1a (top panel) and IP10 (bottom panel) in the paired cervicovaginal secretions. Pearson correlation (R2) and p value are indicated in the graph.
Figure 4.
Figure 4.. DN cells display distinctive transcriptional, phenotypic and functional characteristics as compared to the Trm-like CVT CD8+ T-cells.
Volcano plot showing the genes differentially regulated in the vaginal DN versus the vaginal DP (A) and the vaginal CD69+ SP (B) CD8+ T-cell populations. C) Histograms showing mean frequencies (± SD) of DN, SP, and DP CD8+ T-cells expressing CD49a, CD101, CCR5 and PD-1 as determined by flow cytometry. D) Mean frequencies (± SD) of the indicated phenotype of CD8+ T-cells in blood and vaginal tract (VT) tissue determined by flow cytometry staining. Statistical significance was determined by Mann-Whitney test or a Kruskal-Wallis test with Dunn’s multiple comparisons test. n = 5–8, *p<0.05, **p<0.01, ***p<0.001 and ****p<0.0001. ND: non-detectable. E) Histogram showing the mean frequencies (± SD) of different cytokine-producing DN, CD69+ SP and DN CD8+ T-cells measured by flow cytometry. To test for statistical significance, a Kruskal-Wallis test was performed with Dunn’s multiple comparisons test. F) Representative histograms showing granzyme B, IFN-γ, TNF-α, and TGF-β production by the three cell types.
Figure 5.
Figure 5.. Cervicovaginal tissue CD8+ T-cells exhibit distinctive features as compared to CD8+ T-cells from other tissues.
A) Gene set enrichment analyses showing overlap between upregulated (red) and downregulated (blue) genes in the CD69+ CD8+ T-cell population as compared to DN CD8+ T-cells in the CVT and in previously published gene sets for lung and spleen. B) Venn diagram showing the numbers of overlapping and non-overlapping genes in the two gene sets analyzed. C) Mean frequencies (± SD) (top) and representative plots (bottom) of CD8+ T-cells producing IL-17A and IL-2 upon a 5 hour-PMI/ionomycin stimulation as determined by flow cytometry. To test for statistical significance, a Kruskal-Wallis test was performed with Dunn’s multiple comparisons test. **p<0.01
Figure 6.
Figure 6.. The frequency of DN Tim cells increases in the CVT of HIV-infected women while the transcriptional pattern remains stable.
A) Mean frequencies (± SD) of DN, SP and DP cells in the CVT of women grouped based on their HIV, BV and HSV status. B) Mean levels (± SD) of IL-1a and IL-15 were measured from cervicovaginal fluids by MSD assay. Statistical significance was determined by unpaired t-test or Mann-Whitney test. C) Principal component analysis and D) volcano plot obtained from the transcriptional data of the 3 populations of CD8+ T-cells (DN, SP, and DP) from HIV-positive and HIV-negative women.

References

    1. Klenerman P & Hill A T cells and viral persistence: lessons from diverse infections. Nat Immunol 6, 873–879, doi:10.1038/ni1241 (2005). - DOI - PubMed
    1. Prlic M, Williams MA & Bevan MJ Requirements for CD8 T-cell priming, memory generation and maintenance. Curr Opin Immunol 19, 315–319, doi:10.1016/j.coi.2007.04.010 (2007). - DOI - PubMed
    1. Zhang L & Romero P Metabolic Control of CD8(+) T Cell Fate Decisions and Antitumor Immunity. Trends Mol Med 24, 30–48, doi:10.1016/j.molmed.2017.11.005 (2018). - DOI - PubMed
    1. Sallusto F, Lenig D, Forster R, Lipp M & Lanzavecchia A Two subsets of memory T lymphocytes with distinct homing potentials and effector functions. Nature 401, 708–712, doi:10.1038/44385 (1999). - DOI - PubMed
    1. Gebhardt T et al. Memory T cells in nonlymphoid tissue that provide enhanced local immunity during infection with herpes simplex virus. Nat Immunol 10, 524–530, doi:10.1038/ni.1718 (2009). - DOI - PubMed

Publication types

MeSH terms