

Data mining analysis of human gut microbiota links Fusobacterium spp. with colorectal cancer onset
- PMID: 31312073
- PMCID: PMC6614120
- DOI: 10.6026/97320630015372
Data mining analysis of human gut microbiota links Fusobacterium spp. with colorectal cancer onset
Abstract
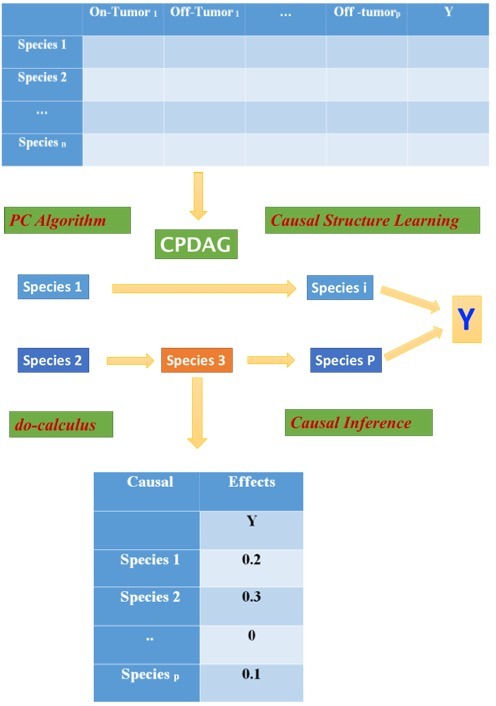
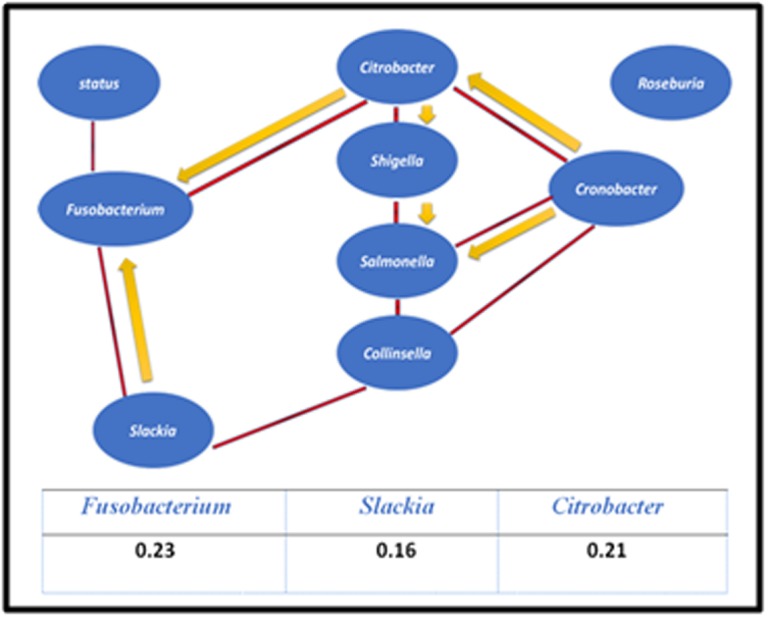
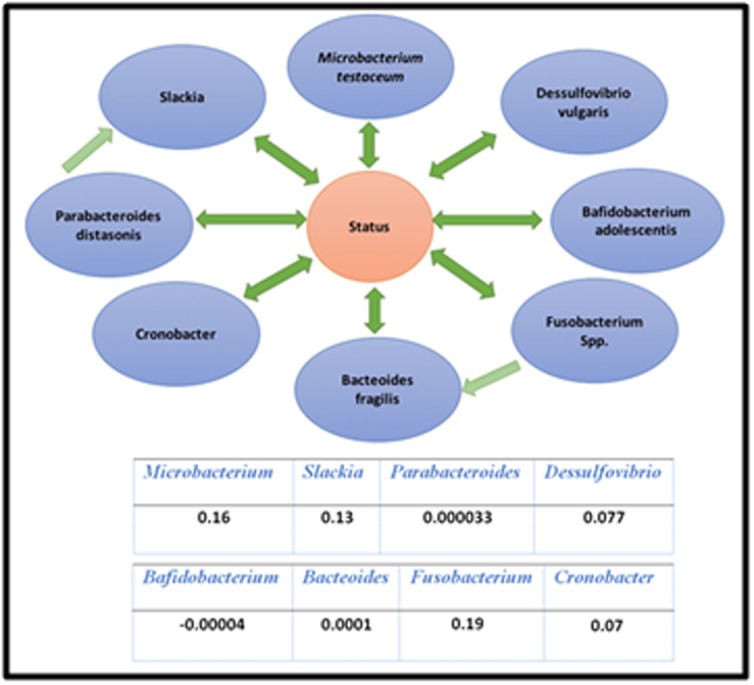
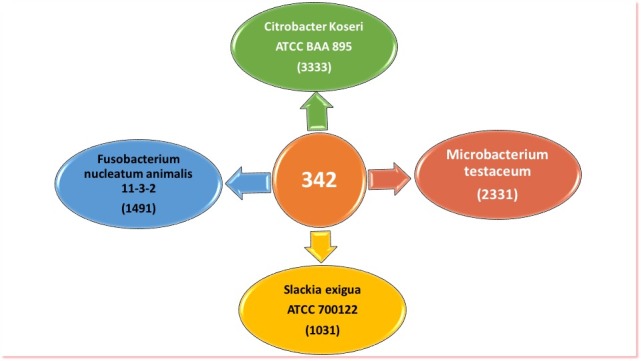
Gut microbiota and their metabolites play a vital role in colon health and disease. Accumulating evidence suggests that the gut microbiota contributes to the risk of colorectal cancer (CRC). However, the role of a specific microbial community together with their metabolites contributing to the risk, initiation and progression of CRC is still unknown. Hence, we used a Bayesian Networks in combination with the IDA (Intervention calculus when the DAG is absent) to generate a graphical model that allows causal relationships to be inferred from observational data. Results from the analysis of publically available datasets showed that four species: Fusobacteium, Citrobacter, Microbacterium and Slaxkia have estimated non-null lower bounds of causal effects of CRC. These findings support the hypothesis that specific bacterial species (microbial markers) act in concert with locally modified microbiota to cause or influence CRC progression. Additional comprehensive studies are required to validate the potential use of F. nucleatum, Citrobacter as well as Slackia as microbial biomarkers in CRC for prevention, diagnosis, prognosis and/or therapeutics.
Keywords: Colorectal cancer; Fusobacterium spp; IDA method; bacteria; biomarker; microbiome.
Figures
References
LinkOut - more resources
Full Text Sources
Molecular Biology Databases
Miscellaneous