. 2019 Jun 12;6(6):181566.
doi: 10.1098/rsos.181566. eCollection 2019 Jun.

Unravelling the gender productivity gap in science: a meta-analytical review

Affiliations

Unravelling the gender productivity gap in science: a meta-analytical review

Julia Astegiano et al. R Soc Open Sci. .

Abstract

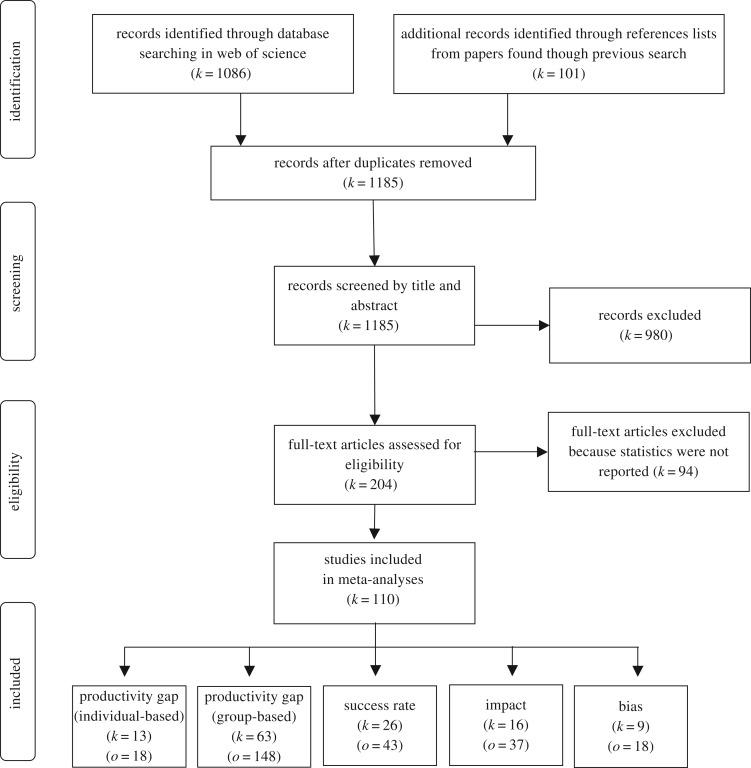
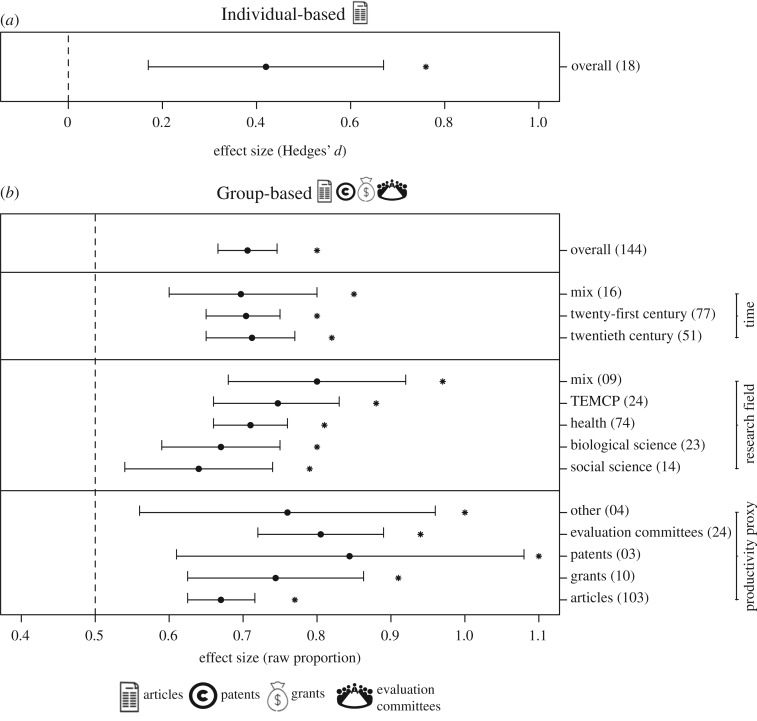
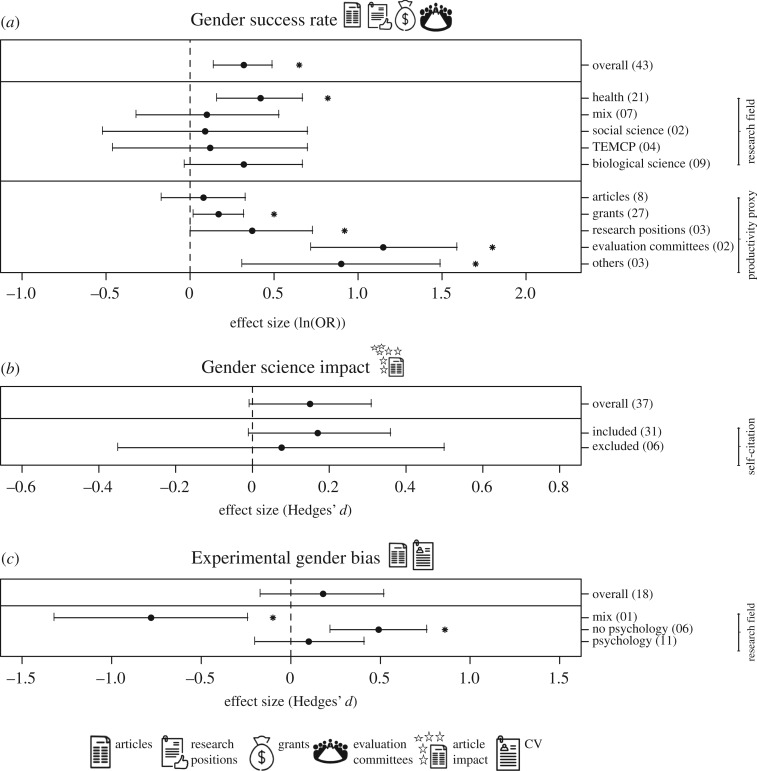
Women underrepresentation in science has frequently been associated with women being less productive than men (i.e. the gender productivity gap), which may be explained by women having lower success rates, producing science of lower impact and/or suffering gender bias. By performing global meta-analyses, we show that there is a gender productivity gap mostly supported by a larger scientific production ascribed to men. However, women and men show similar success rates when the researchers' work is directly evaluated (i.e. publishing articles). Men's success rate is higher only in productivity proxies involving peer recognition (e.g. evaluation committees, academic positions). Men's articles showed a tendency to have higher global impact but only if studies include self-citations. We detected gender bias against women in research fields where women are underrepresented (i.e. those different from Psychology). Historical numerical unbalance, socio-psychological aspects and cultural factors may influence differences in success rate, science impact and gender bias. Thus, the maintenance of a women-unfriendly academic and non-academic environment may perpetuate the gender productivity gap. New policies to build a more egalitarian and heterogeneous scientific community and society are needed to close the gender gap in science.

Keywords: H-index; gender bias; science impact; success rate; women in science; women underrepresentation.


Conflict of interest statement

We have no competing interests.

Figures

Figure 1.
Figure 1.
PRISMA flow diagram representing the flow of information through the decision process of searching and inclusion of articles and observations in the meta-analyses (modified from Moher et al. [18]). k, number of articles; o, number of observations.
Figure 2.
Figure 2.
The gender productivity gap in science. The mean effect sizes ± 95% confidence intervals corresponding to (a) individual- and (b) group-based studies comparing productivity between men and women scientists (Pindividual = 0.0012, Pgroup < 0.0001). The number of observations included in each meta-analysis is reported within parentheses. For group-based studies, the effect sizes of gender productivity depending on the productivity proxy (p = 0.036), the research field (p = 0.189) and the time period (p = 0.951) are also shown. The vertical dashed line in each graphic indicates no difference between men and women scientists. Positive effect size values indicate higher men productivity, whereas negative effect sizes indicate higher women productivity. Asterisks denote the mean effect sizes significantly different from zero for Hedges' d and 0.5 for raw proportion (p < 0.05). Icons illustrate the type of primary response variable included in each meta-analysis.
Figure 3.
Figure 3.
Factors that have been associated with the gender productivity gap in science. The mean effect size ± 95% confidence intervals of (a) gender success rate (p = 0.0004), (b) gender science impact (p = 0.063) and (c) experimental gender bias (p = 0.315). The number of observations included in each meta-analysis is reported within parentheses. The effect size of gender depending on the research field (p = 0.697) and the productivity proxy (p < 0.0001) are shown for success rate. The effect of self-citations on science impact is also shown (p = 0.73). The effect size of gender depending on the research field (Psychology or not, p = 0.0002) is shown for experimental gender bias. The vertical dashed line in each graphic indicates no difference between men and women scientists. Effect size values in the right side of each graphic indicate higher men productivity, whereas those in the left side indicate higher women productivity. Asterisks denote the mean effect sizes significantly different from zero (p < 0.05). Icons illustrate the type of primary response variables included in each meta-analysis.

References

    1. de Beauvoir S. 1949. Le deuxième sexe. Paris, France: Gallimard.
    1. United Nations Educational Scientific and Cultural, Organization. 2015. UNESCO Global Science Report: Towards 2030. See http://unesdoc.unesco.org/images/0023/002354/235406e.pdf%5Cnhttp://unesd.... - PubMed
    1. O'Brien KR, Hapgood KP. 2012. The academic jungle: ecosystem modelling reveals why women are driven out of research. Oikos 121, 999–1004. (10.1111/j.1600-0706.2012.20601.x) - DOI
    1. Shaw AK, Stanton DE. 2012. Leaks in the pipeline: separating demographic inertia from ongoing gender differences in academia. Proc. R. Soc. B 279, 3736–3741. (10.1098/rspb.2012.0822) - DOI - PMC - PubMed
    1. Ceci SJ, Williams WM. 2011. Understanding current causes of women's underrepresentation in science. Proc. Natl Acad. Sci. USA 108, 3157–3162. (10.1073/pnas.1014871108) - DOI - PMC - PubMed