

doi: 10.1016/j.ekir.2019.04.003.
eCollection 2019 Jul.
A Multimodality Approach to Assessing Factor I Genetic Variants in Atypical Hemolytic Uremic Syndrome
Affiliations
- PMID: 31312772
- PMCID: PMC6609824
- DOI: 10.1016/j.ekir.2019.04.003
Item in Clipboard
A Multimodality Approach to Assessing Factor I Genetic Variants in Atypical Hemolytic Uremic Syndrome
Kidney Int Rep.
.
No abstract available
Figures
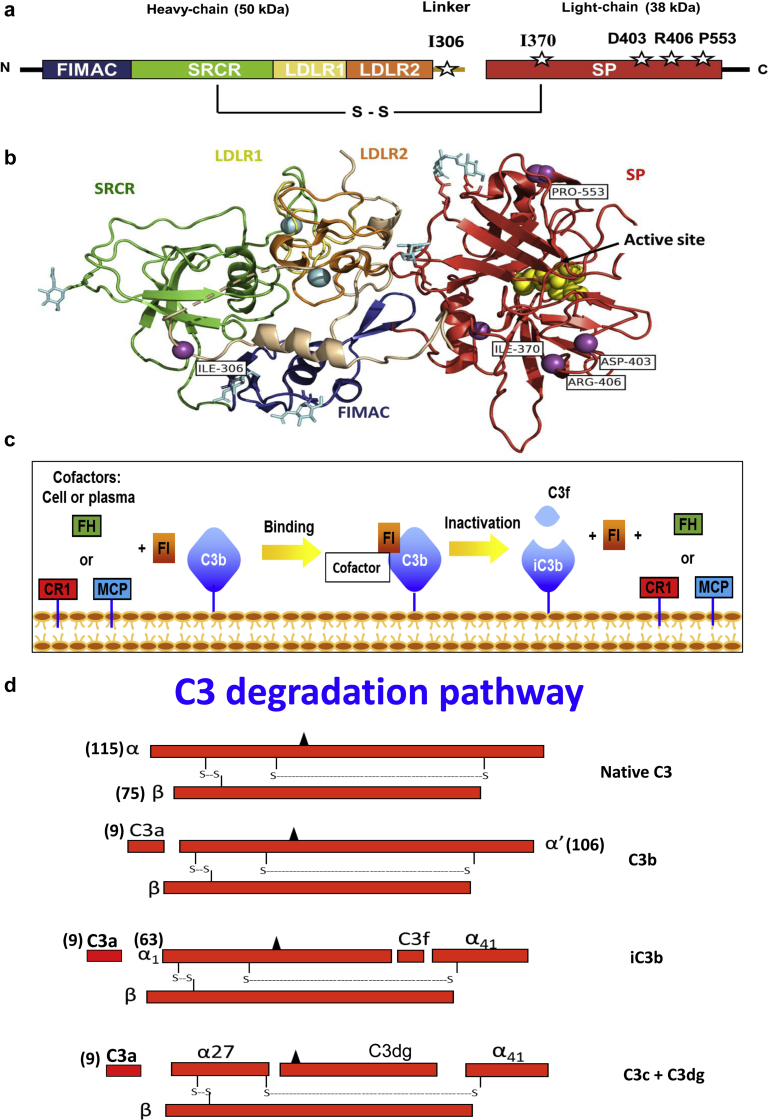
Structure and function of Factor I (FI). Cartoon schematic of FI. White stars represent the location of the variants (a). Crystal structure of FI (generated using Pymol). Symbols indicate the following: purple circles = variant sites; blue circles = calcium atoms; yellow circles = serine protease (SP) site; light-blue hexagons = N-glycosylation sites. Thick arrow-shaped structures in the various domains are beta-pleated sheets. The dotted beige line in the linker represents a structure that is not visible in the crystal structure, and its location is therefore hypothetical (b). C3b binding and cofactor activity. FI, in the presence of a cofactor protein (factor H [FH], membrane cofactor protein [MCP; CD46], or complement receptor 1 [CR1; CD35]), cleaves the αˈ chain of C3b to obtain α41 and α43 (liberating C3f, a 2-kDa fragment), forming iC3b. Next, CR1 achieves further cleavage of iC3b to C3c and C3dg (c,d). Arg, arginine; Asp, aspartic acid; C, carboxyl-terminus; FIMAC, FI membrane attack complex; Ile, isoleucine; LDLR1, low-density lipoprotein receptor class 1; LDLR2, low-density lipoprotein receptor class 2; N, amino-terminus; Pro, proline; SRCR, scavenger receptor cysteine-rich.

Mapping of the Factor I (FI) variants on the surface of C3b in a complex with FI and Factor H (FH; complement control repeats 1–4 and 19–20]. Color coding is as follows: C3b, gray; FH, cyan; serine protease, red; FI membrane attack complex, blue; linker, beige; low-density lipoprotein receptor (LDLR) class 1, yellow; LDLR class 2, orange; scavenger receptor cysteine-rich, green. FI domains are color coded to match those in Figure 1. Refer to the text for further explanation of the structural evaluation for each variant. D, aspartic acid; H, histidine; I, isoleucine; N, asparagine; P, proline; R, arginine; S, serine; V, valine. Adapted with permission from Forneris F, Wu J, Xue X, et al. Regulators of complement activity mediate inhibitory mechanisms through a common C3b-binding mode. EMBO J. 2016;35:1133–1149. Copyright © 2016 The Authors. Published under the terms of the CC BY-NC-ND 4.0 license.

Functional evaluation of Factor I (FI) variant R406H: cofactor activity. The fluid-phase C3b cofactor activity of the variant FI with its cofactor proteins (Factor H [FH], membrane cofactor protein [MCP], or complement receptor 1 [CR1]) was assessed by cleavage of purified C3b to iC3b and compared to wild type (WT). The percentage of alpha chain remaining and the generation of an α1 fragment indicates cleavage of C3b to iC3b. A kinetic analysis of cofactor activity was conducted at time 0, 10, 20, and 30 minutes. Cleavage rate was measured by densitometric analysis of the alpha chain remaining or the generation of α1 relative to the β chain. Representative Western blot for FH, MCP, and CR1 (a–c). Densitometric quantification of the Western blot for FH, MCP, and CR1 (d–f). Data represent 3 separate experiments with bars corresponding to the SEM. Upon comparison to WT FI, the cofactor activity of variant R406H is defective with both FH and CR1. For FH, the P value for the difference in the percentage of alpha chain remaining between WT and variant was 0.05, and for the difference in α1 generation, it was 0.0037. For CR1, the P value for the difference in the percentage of alpha chain remaining was 0.028, and for the difference in α1 generation, it was 0.0081. No defect was observed with MCP as the cofactor protein. H, histidine; R, arginine.

Cofactor activity of I306V (a), P553S (b), and D403N (c), compared to wild type. Densitometric quantification of the Western blot for percentage of alpha chain remaining for wild type and each variant. Data represent 3 separate experiments with bars corresponding to the SEM. No significant differences were observed. Due to the limited cleavage of C3b with D403N using membrane cofactor protein (MCP) as the cofactor, we conducted the experiment under low ionic strength conditions (25 mM NaCl) and obtained the same results (see Supplementary Figure S1). CR1, complement receptor 1; D, aspartic acid; FH, Factor H; I, isoleucine; N, asparagine; P, proline; S, serine; V, valine.

Biosynthetic evaluation of I370N. Western blots of supernatants and cell lysates from transfected wild type and I370N are shown. Supernatants: the reduced blot for wild type demonstrates a band at 50 kDa that is the heavy chain, and a band at 38 kDa that is the light chain. The nonreduced blot shows a single band of full length Factor I (FI) at ∼88 kDa. No bands are seen for I370N, indicating that the protein either is not synthesized or not secreted. Purified FI differs slightly in molecular weight from the recombinant wild type (particularly under non-reducing conditions), most likely secondary to a difference in the glycosylation (a). Lysates: the reduced and nonreduced blots show a predominant single band at 88 kDa. This represents Pro-FI. Mutant protein is observed in the lysate, indicating that the protein is synthesized but is not secreted, as it is absent in the supernatants. The polyclonal antibody to FI predominantly binds to the heavy chain at the expected molecular weight (50 kDA) but variably detects the light chain under reducing conditions (b). I, isoleucine; N, asparagine.

Diagnostic algorithm for atypical hemolytic uremic syndrome (aHUS). ab, antibody; ADAMTS13, a disintegrin and metalloproteinase with a thrombospondin type 1 motif, member 13; C3Nef, C3 nephritic factor; FB, Factor B; FH, Factor H; FI, Factor I; MCP, membrane cofactor protein; STEC, Shiga toxin–producing Escherichia coli; TTP, thrombotic thrombocytopenic purpura.
References
-
- Goodship T.H., Cook H.T., Fakhouri F. Atypical hemolytic uremic syndrome and C3 glomerulopathy: conclusions from a “Kidney Disease: Improving Global Outcomes“ (KDIGO) Controversies Conference. Kidney Int. 2017;91:539–551. - PubMed
-
- Kavanagh D., Richards A., Noris M. Characterization of mutations in complement factor I (CFI) associated with hemolytic uremic syndrome. Mol Immunol. 2007;45:95–105. - PubMed
-
- Le Quintrec M., Zuber J., Moulin B. Complement genes strongly predict recurrence and graft outcome in adult renal transplant recipients with atypical hemolytic and uremic syndrome. Am J Transplantation. 2013;13:663–675. - PubMed
Grants and funding
LinkOut - more resources
Full Text Sources
