

Therapeutic Vaccination Refocuses T-cell Responses Towards Conserved Regions of HIV-1 in Early Treated Individuals (BCN 01 study)
- PMID: 31312806
- PMCID: PMC6610778
- DOI: 10.1016/j.eclinm.2019.05.009
Therapeutic Vaccination Refocuses T-cell Responses Towards Conserved Regions of HIV-1 in Early Treated Individuals (BCN 01 study)
Erratum in
-
Corrigendum to 'Therapeutic vaccination refocuses T-cell responses towards conserved regions of HIV-1 in early treated individuals (BCN 01 study)' EClinicalMedicine 11 (2019) 65-80.EClinicalMedicine. 2020 Jan 10;18:100250. doi: 10.1016/j.eclinm.2019.100250. eCollection 2020 Jan. EClinicalMedicine. 2020. PMID: 31956858 Free PMC article.
Abstract
Background: Strong and broad antiviral T-cell responses targeting vulnerable sites of HIV-1 will likely be a critical component for any effective cure strategy.
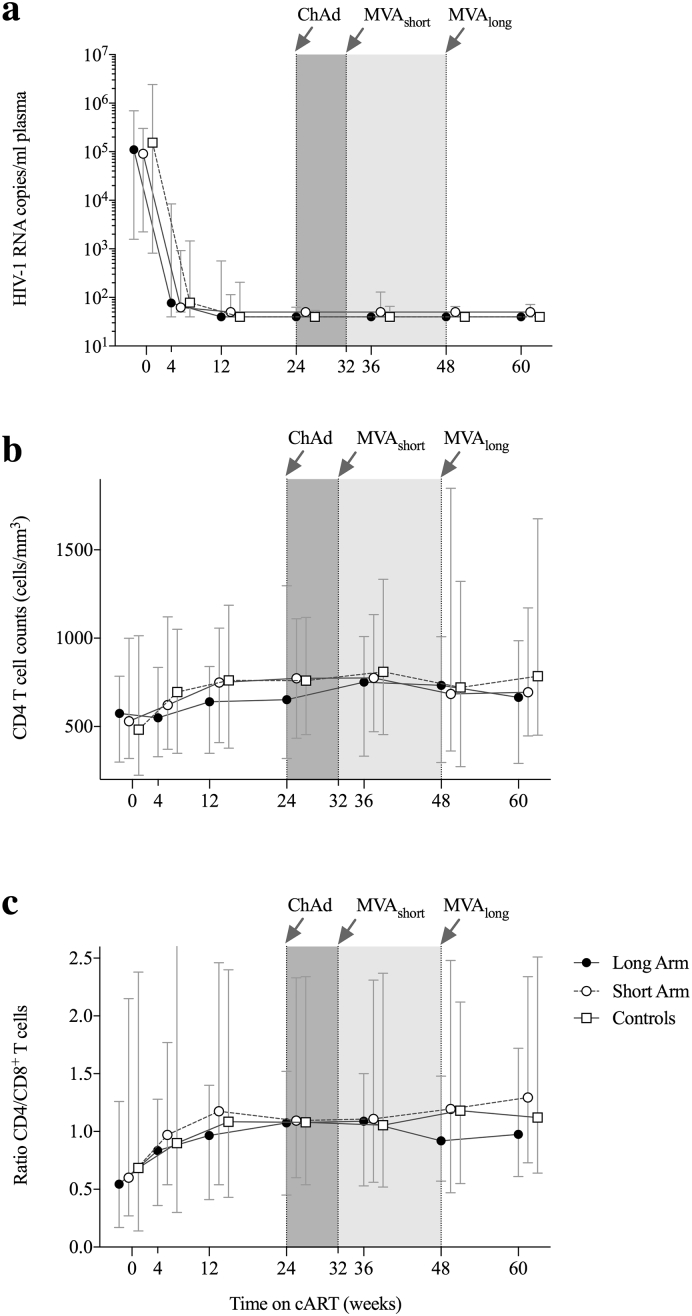
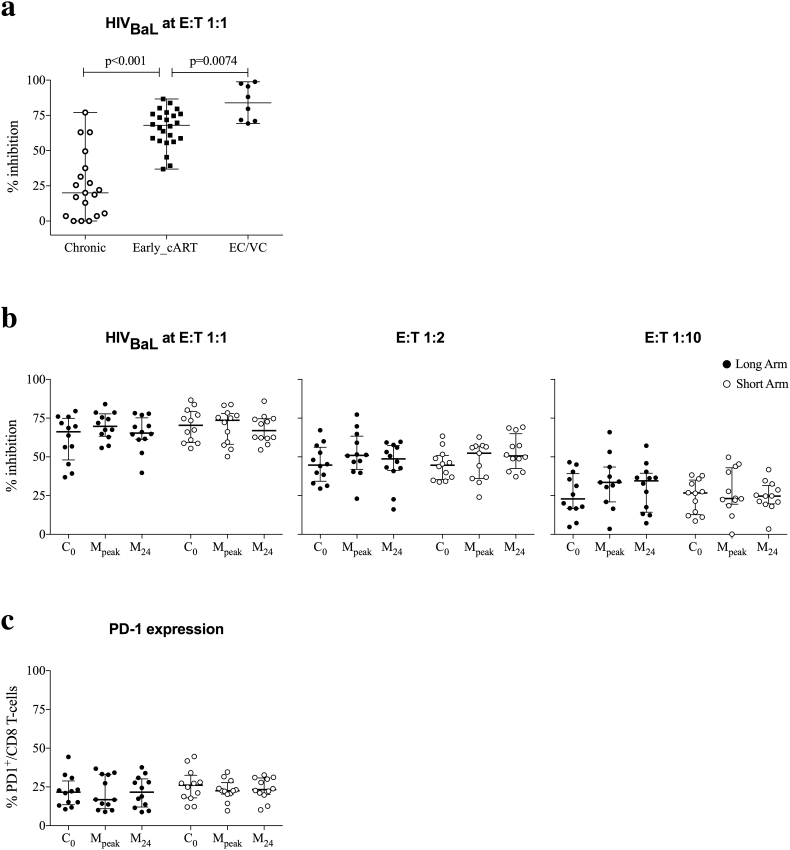
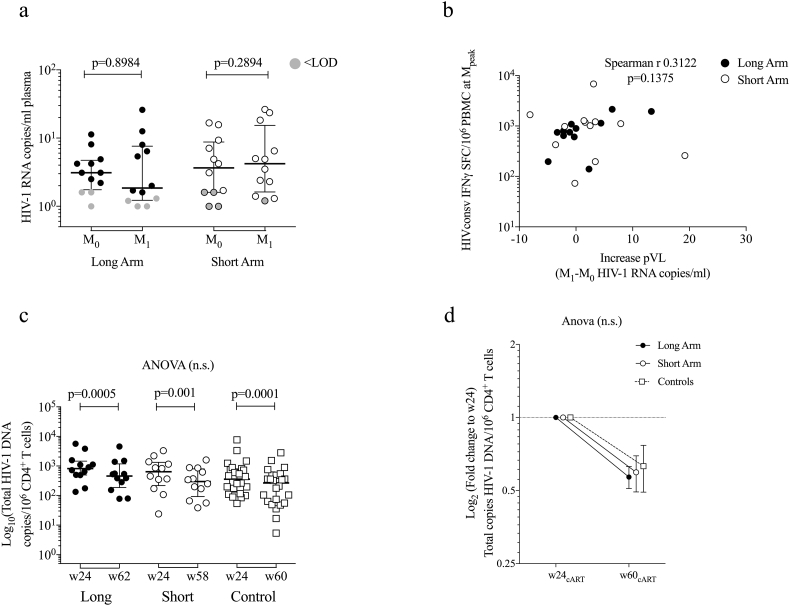
Methods: BCN01 trial was a phase I, open-label, non-randomized, multicenter study in HIV-1-positive individuals diagnosed and treated during early HIV-1 infection to evaluate two vaccination regimen arms, which differed in the time (8 versus 24 week) between the ChAdV63.HIVconsv prime and MVA.HIVconsv boost vaccinations. The primary outcome was safety. Secondary endpoints included frequencies of vaccine-induced IFN-γ+ CD8+ T cells, in vitro virus-inhibitory capacity, plasma HIV-1 RNA and total CD4+ T-cells associated HIV-1 DNA. (NCT01712425).
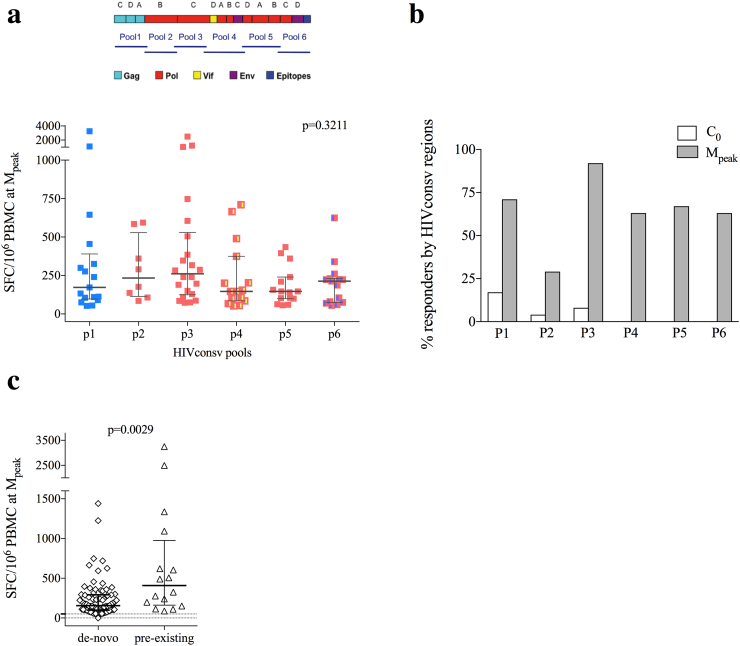
Findings: No differences in safety, peak magnitude or durability of vaccine-induced responses were observed between long and short interval vaccination arms. Grade 1/2 local and systemic post-vaccination events occurred in 22/24 individuals and resolved within 3 days. Weak responses to conserved HIV-1 regions were detected in 50% of the individuals before cART initiation, representing median of less than 10% of their total HIV-1-specific T cells. All participants significantly elevated these subdominant T-cell responses, which after MVA.HIVconsv peaked at median (range) of 938 (73-6,805) IFN-γ SFU/106 PBMC, representing on average 58% of their total anti-HIV-1 T cells. The decay in the size of the HIV-1 reservoir was consistent with the first year of early cART initiation in both arms.
Interpretation: Heterologous prime-boost vaccination with ChAdV63-MVA/HIVconsv was well-tolerated and refocused pre-cART T-cell responses towards more protective epitopes, in which immune escape is frequently associated with reduced HIV-1 replicative fitness and which are common to most global HIV-1 variants.
Funding: HIVACAT Catalan research program for an HIV vaccine and Fundació Gloria Soler. Vaccine manufacture was jointly funded by the Medical Research Council (MRC) UK and the UK Department for International Development (DFID) under the MRC/DFID Concordat agreements (G0701669.
Research in context: Evidence Before this Study: T cells play an important role in the control of HIV infection and may be particularly useful for HIV-1 cure by killing cells with reactivated HIV-1. Evidence is emerging that not all T-cell responses are protective and mainly only those targeting conserved regions of HIV-1 proteins are effective, but typically immunologically subdominant, while those recognizing hypervariable, easy-to-escape immunodominant 'decoys' do not control viremia and do not protect from a loss of CD4 T cells. We pioneered a vaccine strategy focusing T-cell responses on the most conserved regions of the HIV-1 proteome using an immunogen designated HIVconsv. T cells elicited by the HIVconsv vaccines in HIV-uninfected UK and Kenyan adults inhibited in vitro replication of HIV-1 isolates from 4 major global clades A, B, C and D.Added Value of this Study: The present study demonstrated the concept that epitopes subdominant in natural infection, when taken out of the context of the whole HIV-1 proteome and presented to the immune system by a potent simian adenovirus prime-poxvirus MVA boost regimen, can induce strong responses in patients on antiretroviral treatment and efficiently refocus HIV-1-specific T-cells to the protective epitopes delivered by the vaccine.Implications of all the Available Evidence: Nearly all HIV-1 vaccine strategies currently emphasize induction of broadly neutralizing Abs. The HIVconsv vaccine is one of a very few approaches focussing exclusively on elicitation of T cells and, therefore, can complement antibody induction for better prevention and cure. Given the cross-clade reach on the HIVconsv immunogen design, if efficient, the HIVconsv vaccines could be deployed globally. Effective vaccines will likely be a necessary component in combination with other available preventive measures for halting the HIV-1/AIDS epidemic.
Conflict of interest statement
BM, PC, ASB, MR, MCP, SML, BC, JMP and CB report grants from the HIVACAT Catalan research program for an HIV vaccine and Fundació Gloria Soler. BM holds a post-doctoral fellowship grant from ISCIII (JR 13/00024) from 2014 to 2016 during the conduct of the study and is a consultant for AELIX THERAPEUTICS, S.L., outside the submitted work. SML holds a PhD grant from DGR (2013FI_B 00275) from 2013 to 2016 during the conduct of the study. JMM received a personal 80:20 research grant from the Institut d'Investigacions Biomèdiques August Pi i Sunyer (IDIBAPS), Barcelona, Spain, during 2017–19 and reports grants and personal fees from Abbvie, Angelini, Contrafect, Genentech, Gilead, Jansen, Medtronic, MSD, Pfizer, ViiV Healthcare, outside the submitted work. LD reports being employer of Immunocore. TH reports grants from Medical Research Council UK, during the conduct of the study, and has a patent US 7981430B2 issued. CB is founder, CSO and shareholder of AELIX THERAPEUTIC, S.L. BC is founder, consultant and shareholder of AELIX THERAPEUTICS, S.L. TH reports grants from Medical Research Council UK, during the conduct of the study, and has a patent US 7981430B2 issued. SML hold a PhD grant from DGR (2013FI_B 00275) from 2013 to 2016 during the conduct of the study. CM, ASB, PCo, RE, NP, IR, CR, MM, AC, NB, EW, HY have nothing to disclose.
Figures


References
-
- Mothe B., Ibarrondo J., Llano A., Brander C. Virological, immune and host genetics markers in the control of HIV infection. Dis Markers. 2009;27(3):105–120. - PMC - PubMed
- Mothe B, Ibarrondo J, Llano A, Brander C. Virological, immune and host genetics markers in the control of HIV infection. Dis Markers. 2009;27(3):105-120. doi:10.3233/DMA-2009-0655 - PMC - PubMed
-
- Schmitz J.E., Kuroda M.J., Santra S. Control of viremia in simian immunodeficiency virus infection by CD8 + lymphocytes. Science. 1999;283(5403):857–860. http://www.ncbi.nlm.nih.gov/pubmed/9933172 - PubMed
- Schmitz JE, Kuroda MJ, Santra S, et al. Control of viremia in simian immunodeficiency virus infection by CD8 + lymphocytes. Science. 1999;283(5403):857-860. http://www.ncbi.nlm.nih.gov/pubmed/9933172. Accessed November 25, 2015. - PubMed
-
- Cartwright E.K., Spicer L., Smith S.A. CD8(+) lymphocytes are required for maintaining viral suppression in SIV-infected macaques treated with short-term antiretroviral therapy. Immunity. 2016;45(3):656–668. - PMC - PubMed
- Cartwright EK, Spicer L, Smith SA, et al. CD8(+) Lymphocytes Are Required for Maintaining Viral Suppression in SIV-Infected Macaques Treated with Short-Term Antiretroviral Therapy. Immunity. 2016;45(3):656-668. doi:10.1016/j.immuni.2016.08.018 - PMC - PubMed
-
- Ndhlovu Z.M., Kamya P., Mewalal N. Magnitude and kinetics of CD8 + T cell activation during hyperacute HIV infection impact viral set point. Immunity. 2015;43(3):591–604. - PMC - PubMed
- Ndhlovu ZM, Kamya P, Mewalal N, et al. Magnitude and Kinetics of CD8 + T Cell Activation during Hyperacute HIV Infection Impact Viral Set Point. Immunity. 2015;43(3):591-604. doi:10.1016/j.immuni.2015.08.012 - PMC - PubMed
-
- Streeck H., Jolin J.S., Qi Y. Human immunodeficiency virus type 1-specific CD8 + T-cell responses during primary infection are major determinants of the viral set point and loss of CD4 + T cells. J Virol. 2009;83(15):7641–7648. - PMC - PubMed
- Streeck H, Jolin JS, Qi Y, et al. Human immunodeficiency virus type 1-specific CD8 + T-cell responses during primary infection are major determinants of the viral set point and loss of CD4 + T cells. J Virol. 2009;83(15):7641-7648. doi:10.1128/JVI.00182-09 - PMC - PubMed
Associated data
Grants and funding
LinkOut - more resources
Full Text Sources
Other Literature Sources
Medical
Research Materials
