

Functional network connectivity impairments and core cognitive deficits in schizophrenia
- PMID: 31313441
- PMCID: PMC6865503
- DOI: 10.1002/hbm.24723
Functional network connectivity impairments and core cognitive deficits in schizophrenia
Abstract
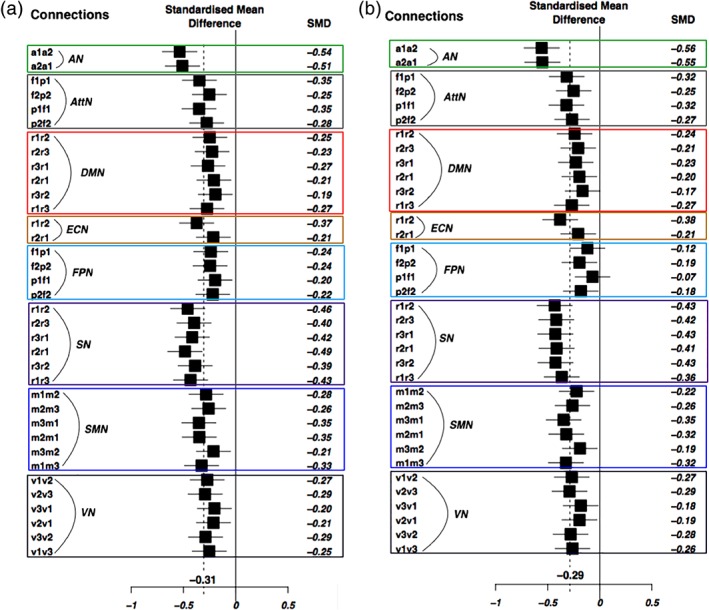
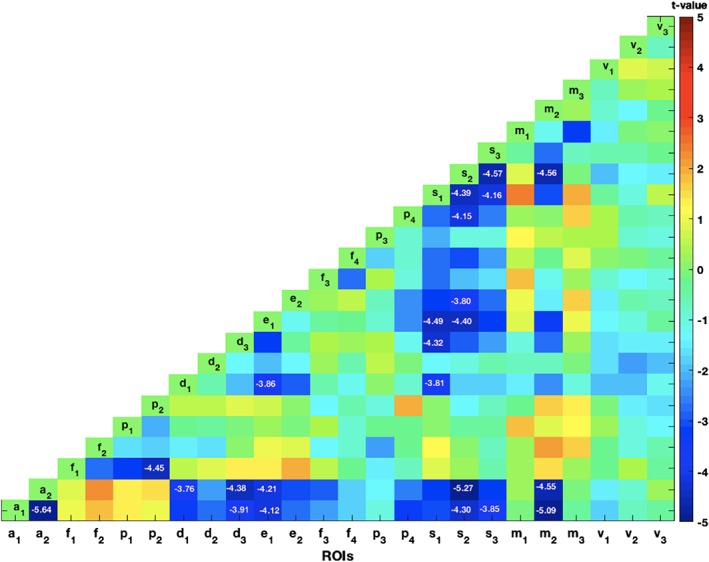
Cognitive deficits contribute to functional disability in patients with schizophrenia and may be related to altered functional networks that serve cognition. We evaluated the integrity of major functional networks and assessed their role in supporting two cognitive functions affected in schizophrenia: processing speed (PS) and working memory (WM). Resting-state functional magnetic resonance imaging (rsfMRI) data, N = 261 patients and 327 controls, were aggregated from three independent cohorts and evaluated using Enhancing NeuroImaging Genetics through Meta Analysis rsfMRI analysis pipeline. Meta- and mega-analyses were used to evaluate patient-control differences in functional connectivity (FC) measures. Canonical correlation analysis was used to study the association between cognitive deficits and FC measures. Patients showed consistent patterns of cognitive and resting-state FC (rsFC) deficits across three cohorts. Patient-control differences in rsFC calculated using seed-based and dual-regression approaches were consistent (Cohen's d: 0.31 ± 0.09 and 0.29 ± 0.08, p < 10-4 ). RsFC measures explained 12-17% of the individual variations in PS and WM in the full sample and in patients and controls separately, with the strongest correlations found in salience, auditory, somatosensory, and default-mode networks. The pattern of association between rsFC (within-network) and PS (r = .45, p = .07) and WM (r = .36, p = .16), and rsFC (between-network) and PS (r = .52, p = 8.4 × 10⁻³ ) and WM (r = .47, p = .02), derived from multiple networks was related to effect size of patient-control differences in the functional networks. No association was detected between rsFC and current medication dose or psychosis ratings. Patients demonstrated significant reduction in several FC networks that may partially underlie some of the core neurocognitive deficits in schizophrenia. The strength of connectivity-cognition relationships in different networks was strongly associated with network's vulnerability to schizophrenia.
Keywords: effect size; processing speed; resting-state functional connectivity; working memory.
© 2019 Wiley Periodicals, Inc.
Conflict of interest statement
The authors declare no conflict of interest.
Figures


References
-
- Adhikari, B. M. , Jahanshad, N. , Shukla, D. K. , Turner, J. A. , Grotegerd, D. , Dannlowski, U. , … Kochunov, P. (2018). A resting state fMRI analysis pipeline for pooling inference across diverse cohorts: An ENIGMA rs‐fMRI protocol. Brain Imaging and Behavior. 10.1007/s11682-018-9941-x - DOI - PMC - PubMed
Publication types
MeSH terms
Substances
Grants and funding
- R01DA027680/NIH Blueprint for Neuroscience Research/International
- U01MH108148/NIH Blueprint for Neuroscience Research/International
- 2R01EB015611/NIH Blueprint for Neuroscience Research/International
- R01 DA027680/DA/NIDA NIH HHS/United States
- T32 MH067533/MH/NIMH NIH HHS/United States
- T32MH067533/NIH Blueprint for Neuroscience Research/International
- R01 MH112180/MH/NIMH NIH HHS/United States
- U54EB020403/NIH Blueprint for Neuroscience Research/International
- R01 MH085646/MH/NIMH NIH HHS/United States
- R01MH112180/NIH Blueprint for Neuroscience Research/International
- DP1 DA048968/DA/NIDA NIH HHS/United States
- R01 EB015611/EB/NIBIB NIH HHS/United States
- R01MH085646/NIH Blueprint for Neuroscience Research/International
- U01 MH108148/MH/NIMH NIH HHS/United States
- U54 EB020403/EB/NIBIB NIH HHS/United States
LinkOut - more resources
Full Text Sources
Medical
