. 2019 Nov 1;40(16):4630-4644.
doi: 10.1002/hbm.24726. Epub 2019 Jul 16.

Charting shared developmental trajectories of cortical thickness and structural connectivity in childhood and adolescence

Affiliations

Charting shared developmental trajectories of cortical thickness and structural connectivity in childhood and adolescence

Gareth Ball et al. Hum Brain Mapp. .

Abstract

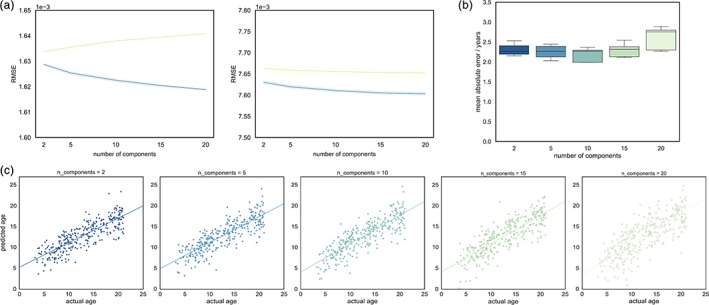
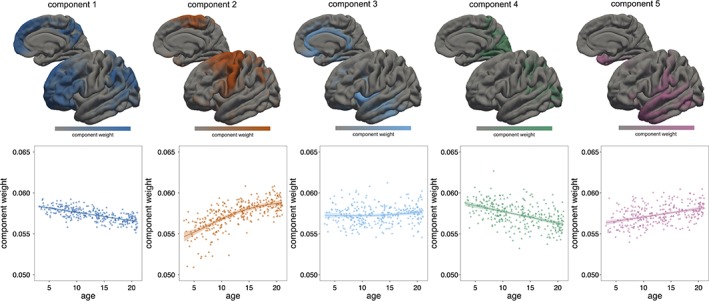
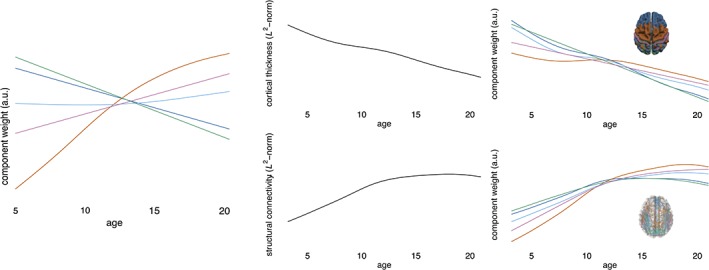
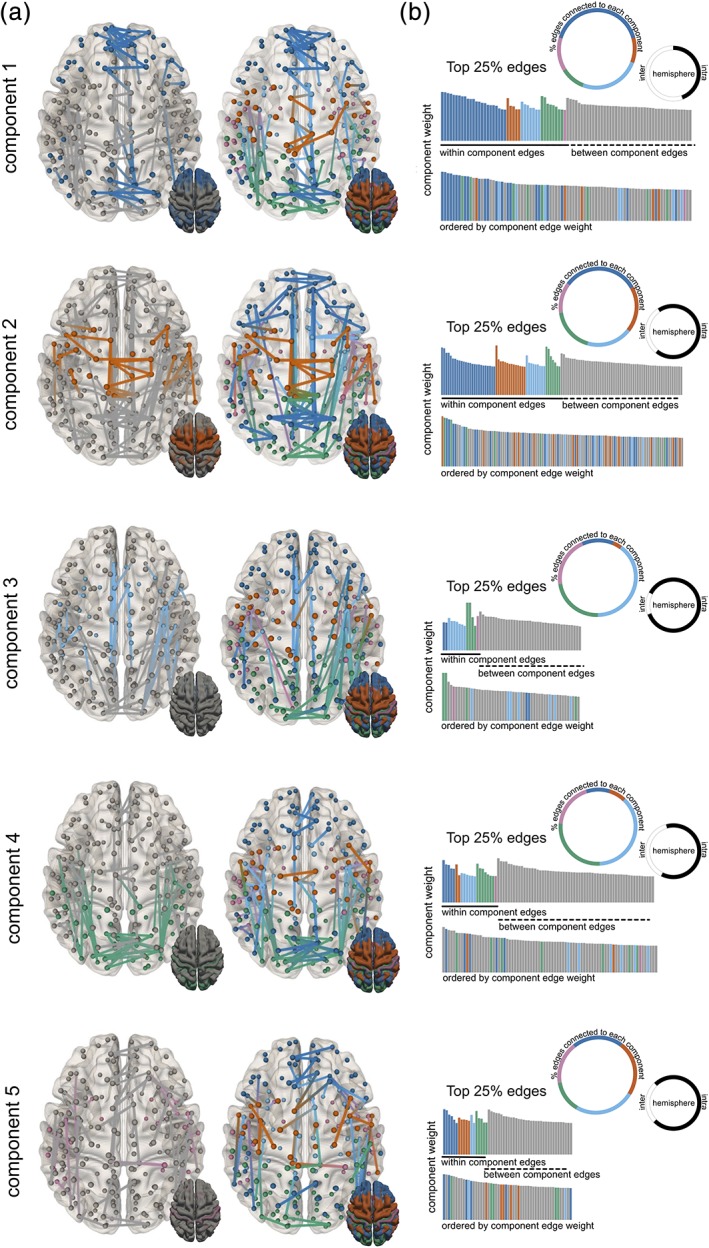
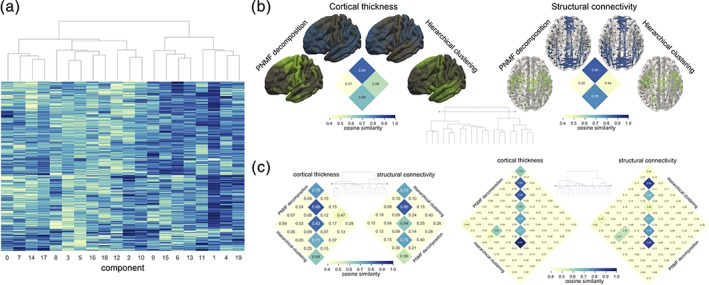
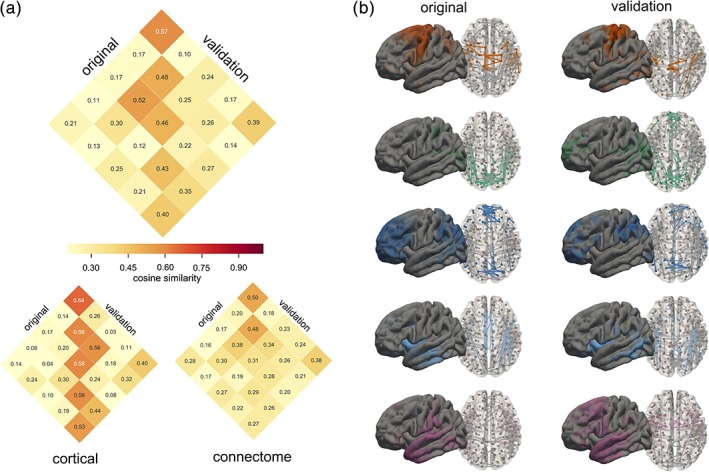
The cortex is organised into broadly hierarchical functional systems with distinct neuroanatomical characteristics reflected by macroscopic measures of cortical morphology. Diffusion-weighted magnetic resonance imaging allows the delineation of areal connectivity, changes to which reflect the ongoing maturation of white matter tracts. These developmental processes are intrinsically linked with timing coincident with the development of cognitive function. In this study, we use a data-driven multivariate approach, nonnegative matrix factorisation, to define cortical regions that co-vary together across a large paediatric cohort (n = 456) and are associated with specific subnetworks of cortical connectivity. We find that age between 3 and 21 years is associated with accelerated cortical thinning in frontoparietal regions, whereas relative thinning of primary motor and sensory regions is slower. Together, the subject-specific weights of the derived set of cortical components can be combined to predict chronological age. Structural connectivity networks reveal a relative increase in strength in connection within, as opposed to between hemispheres that vary in line with cortical changes. We confirm our findings in an independent sample.

Keywords: brain development; connectivity; cortex; diffusion MRI; magnetic resonance imaging; matrix factorisation; multivariate.


Figures

Figure 1
Figure 1
Reconstruction error and age prediction for increasing number of NMF components. (a) Reconstruction errors (RMSE; root mean squared error in terms of Euclidean‐normed cortical thickness or connectivity values), averaged over 5 Wold holdouts, for cortical thickness (left) and structural connectivity data (right). Error for training datapoints (blue) and held‐out test datapoints (green) are shown with 95% C.I. (b) Mean absolute error in age prediction is shown, averaged over 10 cross‐validation folds for each set of NMF components. (c) Individual age predictions are shown for each set of components [Color figure can be viewed at http://wileyonlinelibrary.com]
Figure 2
Figure 2
Cortical NMF components. Spatial maps for the five‐component solution are shown with associated timecourses. Components weights are normalised to account for the mean trend in cortical thickness over time [Color figure can be viewed at http://wileyonlinelibrary.com]
Figure 3
Figure 3
Normalising component weights. Components weights for the 5‐component solution are shown overlaid on each other (left). Prior to NMF decomposition each subject's data were normalised to unit norm. The GAM‐derived trajectory for the norm of the raw data is shown in the centre column, revealing the mean trend for cortical thickness (top) and connectivity (bottom). Combining the normalised trajectories with the group mean shows the raw trajectories of each component (right). Colours are coded according to cortical component [Color figure can be viewed at http://wileyonlinelibrary.com]
Figure 4
Figure 4
Connectivity NMF components. (a) Connectivity subnetworks are shown in the same order as corresponding cortical components. The top 25% edges based on component weight are coloured based on connections to the corresponding component (left) or all components (right) with the colour along each edge representing the membership of nodes at each end (b) networks are summarised based on the proportion of edges connected different modules (coloured circle), the proportion of interhemispheric and intrahemispheric edges (black/white circle) and as a histogram of edge weights ordered by within‐ or between‐modules connectivity (top) and edge strength (bottom) [Color figure can be viewed at http://wileyonlinelibrary.com]
Figure 5
Figure 5
Hierarchical decomposition of NMF components. (a) 20 NMF components are clustered based on similarity of component weights across subjects. (b) The spatial similarity between NMF decompositions at a level of 2 components are shown with maps constructed through the addition of hierarchically clustered components at lower levels. (c) Similarity matrices are shown at the 5 and 10 component level [Color figure can be viewed at http://wileyonlinelibrary.com]
Figure 6
Figure 6
Comparison of discovery and validation cohorts. (a) the average similarity between matched components in the original and validation cohorts are shown (top), within corresponding matrices for similarity of cortical maps and connectivity networks. (b) Comparison of cortical and connectivity components from the original and validation cohorts, ordered by average similarity [Color figure can be viewed at http://wileyonlinelibrary.com]

References

    1. Akshoomoff, N. , Newman, E. , Thompson, W. K. , McCabe, C. , Bloss, C. S. , Chang, L. , … Jernigan, T. L. (2014). The NIH toolbox cognition battery: Results from a large normative developmental sample (PING). Neuropsychology, 28, 1–10. - PMC - PubMed
    1. Andersson, J. L. R. , & Sotiropoulos, S. N. (2016). An integrated approach to correction for off‐resonance effects and subject movement in diffusion MR imaging. NeuroImage, 125, 1063–1078. - PMC - PubMed
    1. Avants, B. B. , Epstein, C. L. , Grossman, M. , & Gee, J. C. (2008). Symmetric diffeomorphic image registration with cross‐correlation: Evaluating automated labeling of elderly and neurodegenerative brain. Medical Image Analysis, 12, 26–41. - PMC - PubMed
    1. Ball, G. , Adamson, C. , Beare, R. , & Seal, M. L. (2017). Modelling neuroanatomical variation during childhood and adolescence with neighbourhood‐preserving embedding. Scientific Reports, 7, 17796. - PMC - PubMed
    1. Ball, G. , Beare, R. , & Seal, M. L. (2017). Network component analysis reveals developmental trajectories of structural connectivity and specific alterations in autism spectrum disorder. Human Brain Mapping, 38, 4169–4184. - PMC - PubMed

Publication types

MeSH terms