Comparative Study
. 2019 Dec;71(12):2047-2058.
doi: 10.1002/art.41047. Epub 2019 Nov 9.

Intrinsically Distinct Role of Neutrophil Extracellular Trap Formation in Antineutrophil Cytoplasmic Antibody-Associated Vasculitis Compared to Systemic Lupus Erythematosus

Affiliations
Comparative Study

Intrinsically Distinct Role of Neutrophil Extracellular Trap Formation in Antineutrophil Cytoplasmic Antibody-Associated Vasculitis Compared to Systemic Lupus Erythematosus

Laura S van Dam et al. Arthritis Rheumatol. 2019 Dec.

Abstract

Objective: Different studies have demonstrated that neutrophil extracellular traps (NETs) may be involved in the pathophysiology of both antineutrophil cytoplasmic antibody (ANCA)-associated vasculitis (AAV) and systemic lupus erythematosus (SLE). AAV and SLE are clinically and pathologically divergent autoimmune diseases with different autoantibodies. However, the respective autoantigens recognized in AAV and SLE have been shown to be an intricate part of NETs. This study aimed to examine whether the mechanisms of NET formation and the composition of NETs are distinct between AAV and SLE.

Methods: To investigate this hypothesis, healthy neutrophils were stimulated with serum from patients with AAV (n = 80) and patients with SLE (n = 59), and the mechanisms of NET formation and NET composition were compared.

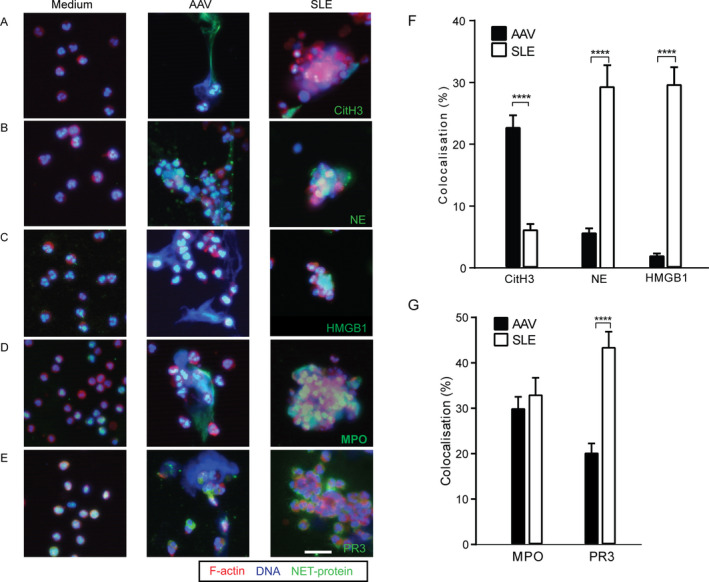
Results: Both patients with AAV and patients with SLE had excessive NET formation, which correlated with the extent of disease activity (in AAV r = 0.5, P < 0.0001; in SLE r = 0.35, P < 0.01). Lytic NET formation over several hours was observed in patients with AAV, as compared to rapid (within minutes), non-lytic NET formation coinciding with clustering of neutrophils in patients with SLE. AAV-induced NET formation was triggered independent of IgG ANCAs, whereas SLE immune complexes (ICx) induced NET formation through Fcγ receptor signaling. AAV-induced NET formation was dependent on reactive oxygen species and peptidyl arginine deaminases, and AAV-induced NETs were enriched for citrullinated histones (mean ± SEM 23 ± 2%). In contrast, SLE-induced NETs had immunogenic properties, including binding with high mobility group box chromosomal protein 1 (mean ± SEM 30 ± 3%) and enrichment for oxidized mitochondrial DNA, and were involved in ICx formation.

Conclusion: The morphologic features, kinetics, induction pathways, and composition of excessive NET formation are all intrinsically distinct in AAV compared to SLE. Recognizing the diversity of NET formation between AAV and SLE provides a better understanding of the pathophysiologic role of NETs in these different autoimmune diseases.


Figures

Figure 1
Figure 1
Lytic neutrophil extracellular trap (NET) formation in patients with antineutrophil cytoplasmic antibody–associated vasculitis (AAV) compared to non‐lytic NET formation in patients with systemic lupus erythematosus (SLE). A, Ex vivo NET formation was measured in the serum of 80 patients with AAV, 59 patients with SLE, and 29 healthy controls (HCs), using a highly sensitive NET quantification assay (see ref. 26). Symbols represent the NET area per imaged neutrophil in each sample; horizontal lines show the median. B, Representative confocal microscopy images show the results of the NET quantification assay in PKH‐labeled and Sytox green–stained neutrophils. Original magnification × 10; bar = 20 μm. C, Live‐cell imaging shows representative examples of AAV‐ and SLE‐induced NET formation over time (for full movies, see Supplementary Movies 1, 2, and 3 [http://onlin​elibr​ary.wiley.com/doi/10.1002/art.41047/​abstract]). Original magnification × 20; bar = 20 μm. D and E, In patients with AAV, the correlation of NET formation with disease activity as measured by the Birmingham Vasculitis Activity Score (BVAS) was assessed (D), and NET formation was compared between AAV patients with a BVAS of 0 and those with a BVAS of >0 (E). F and G, In patients with SLE, the correlation of NET formation with disease activity as measured by the SLE Disease Activity Index (SLEDAI) was assessed (F), and NET formation was compared between SLE patients with a SLEDAI score of <4 and those with a SLEDAI score of ≥4 (G). Symbols represent individual samples; horizontal lines show the median. Statistical correlations were assessed using Pearson's r test. * = P < 0.05; **** = P < 0.0001 by Mann‐Whitney U test.
Figure 2
Figure 2
NET formation is triggered by SLE immune complexes (ICx) in an Fcγ receptor (FcγR)–dependent manner, but not by antineutrophil cytoplasmic antibody (ANCA IgG). A, IgG levels were compared before and after depletion of IgG from the serum of patients with ANCA‐positive AAV (n = 14) and patients with antinuclear antibody–positive SLE (n = 10). IgG was depleted by protein G–agarose beads. B, Ex vivo NET formation in IgG‐depleted patient serum was measured. Results are the mean ± SEM ratio compared to NET formation in the whole serum (broken horizontal line). C, Ex vivo NET formation in the presence of isolated soluble IgG from patient serum was measured. Results are the mean ± SEM fold increase relative to NET formation in the presence of soluble IgG from HC serum (n = 6) (broken horizontal line). D, Ex vivo NET formation in the presence of immobilized IgG from patient serum or intravenous immunoglobulin (IVIG) was measured. Results are the mean ± SEM fold increase compared to NET formation in the presence of immobilized IgG from HC serum (n = 6) (broken horizontal line). E, Ex vivo NET formation was measured after FcγR signaling blockade by the Syk inhibitor R406. Results are the mean ± SEM ratio compared to untreated neutrophils stimulated with the same serum sample (broken horizontal line); representative data from 3 experiments are shown. * = P < 0.05; ** = P < 0.01 by Mann‐Whitney U test. med = medium (see Figure 1 for other definitions).
Figure 3
Figure 3
Citrullinated histone 3 (CitH3) is enriched on AAV‐induced NETs, whereas high mobility group box chromosomal protein 1 (HMGB‐1) is exclusively present on SLE‐induced NETs. A–E, Immunofluorescence staining was used to assess NET‐related proteins on AAV‐induced and SLE‐induced NETs. Representative overlay images show the presence of CitH3 (A), neutrophil elastase (NE) (B), HMGB‐1 (C), myeloperoxidase (MPO) (D), and proteinase 3 (PR3) (E) on unstimulated neutrophils (Medium) compared to AAV‐induced and SLE‐induced NETs. Cells were stained for F‐actin (phalloidin red), DNA (Hoechst blue), and different NET‐related proteins (green). Original magnification × 20; bar = 20 μm. F and G, The percentage colocalization of CitH3, neutrophil elastase, and HMGB‐1 (F) and MPO and PR3 (G) was determined on DNA from AAV‐induced and SLE‐induced NETs. Results are the mean ± SEM. **** = P < 0.0001 by Mann‐Whitney U test. See Figure 1 for other definitions.
Figure 4
Figure 4
Immunoglobulins bind to SLE‐induced NETs, implicating NETs as a substrate for immune complexes. The potential binding of serum autoantibodies from patients with AAV (n = 4) and patients with SLE (n = 3) to AAV‐ and SLE‐induced NETs was studied by immunofluorescence staining of IgG, IgM, or IgA. A and B, Representative images show IgG, IgM, and IgA autoantibody binding on AAV‐induced NETs (A) and SLE‐induced NETs (B). Original magnification × 20; bars = 20 μm. C, The percentage colocalization of IgG, IgM, and IgA on AAV‐induced and SLE‐induced NETs was determined. Results are the mean ± SEM percentage of total DNA area. **** = P < 0.0001 by Mann‐Whitney U test. < = not detectable (see Figure 1 for other definitions).
Figure 5
Figure 5
Oxidized mitochondrial DNA is enriched in SLE‐induced NETs compared to AAV‐induced NETs. A, Immunofluorescence microscopy analysis of unstimulated neutrophils (Medium), AAV‐induced NETs, and SLE‐induced NETs was carried out with MitoSOX Red labeling of the neutrophils after staining for TOMM20 (green) and DNA (Hoechst blue). Representative images are shown. Original magnification × 20; bar = 20 μm. B and C, The percentage colocalization of TOMM20 (B) and MitoSOX Red (C) was determined on NETs. Results are the mean ± SEM percentage of total DNA area per image. *** = P < 0.001 by Mann‐Whitney U test. < = not detectable (see Figure 1 for other definitions).
Figure 6
Figure 6
The regulators of NET formation differ between AAV and SLE. A, AAV‐induced and SLE‐induced NET formation was quantified after peptidyl arginine deaminase (PAD) inhibition with 200 μM chloramidine (Cl‐amidine), a pan‐PAD inhibitor. Results are the mean ± SEM ratio of NET formation before and after PAD inhibition in serum from patients with AAV (n = 6) and patients with SLE (n = 8) as compared to its paired control serum sample (broken horizontal line). B, Representative immunofluorescence images show PKH‐labeled neutrophils (red), DNA (Hoechst blue), and citrullinated histone 3 (CitH3) colocalization (green) on AAV‐ and SLE‐induced NETs with and without PAD inhibition by Cl‐amidine. Original magnification × 20; bar = 20 μm. C, AAV‐induced and SLE‐induced NET formation was quantified after NADPH oxidase inhibition with 1 μM diphenyleneiodonium (DPI). Results are the mean ± SEM ratio of NET formation before and after NAPDH oxidase inhibition in serum from patients with AAV (n = 10) and patients with SLE (n = 9) as compared to its paired control serum sample (broken horizontal line). * = P < 0.05; ** = P < 0.01 by Wilcoxon's matched pairs test. See Figure 1 for other definitions.

References

    1. Jennette JC, Wilkman AS, Falk RJ. Anti‐neutrophil cytoplasmic autoantibody‐associated glomerulonephritis and vasculitis. Am J Pathol 1989;135:921–30. - PMC - PubMed
    1. D'Cruz DP, Khamashta MA, Hughes GR. Systemic lupus erythematosus. Lancet 2007;369:587–96. - PubMed
    1. Kessenbrock K, Krumbholz M, Schönermarck U, Back W, Gross WL, Werb Z, et al. Netting neutrophils in autoimmune small‐vessel vasculitis. Nat Med 2009;15:623–5. - PMC - PubMed
    1. Garcia‐Romo GS, Caielli S, Vega B, Connolly J, Allantaz F, Xu Z, et al. Netting neutrophils are major inducers of type I IFN production in pediatric systemic lupus erythematosus. Sci Transl Med 2011;3:73ra20. - PMC - PubMed
    1. Lande R, Ganguly D, Facchinetti V, Frasca L, Conrad C, Gregorio J, et al. Neutrophils activate plasmacytoid dendritic cells by releasing self‐DNA‐peptide complexes in systemic lupus erythematosus. Sci Transl Med 2011;3:73ra19. - PMC - PubMed

Publication types

MeSH terms