. 2019 Oct 11;25(57):13208-13217.
doi: 10.1002/chem.201902804. Epub 2019 Sep 13.

Simulated Sunlight Selectively Modifies Maillard Reaction Products in a Wide Array of Chemical Reactions

Affiliations

Simulated Sunlight Selectively Modifies Maillard Reaction Products in a Wide Array of Chemical Reactions

Daniel Hemmler et al. Chemistry. .

Abstract

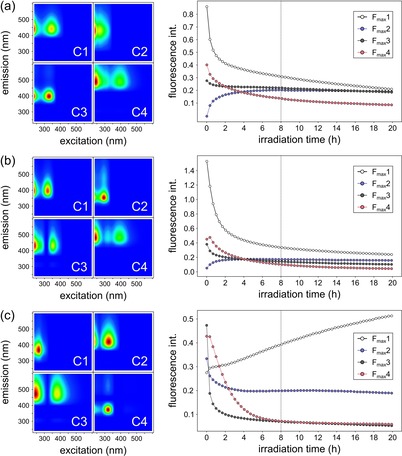
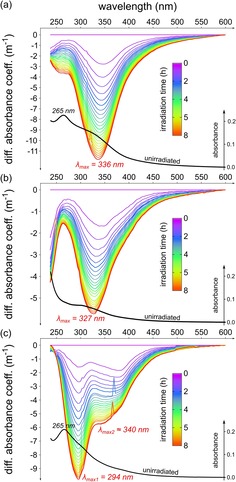
The photochemical transformation of Maillard reaction products (MRPs) under simulated sunlight into mostly unexplored photoproducts is reported herein. Non-enzymatic glycation of amino acids leads to a heterogeneous class of intermediates with extreme chemical diversity, which is of particular relevance in processed and stored food products as well as in diabetic and age-related protein damage. Here, three amino acids (lysine, arginine, and histidine) were reacted with ribose at 100 °C in water for ten hours. Exposing these model systems to simulated sunlight led to a fast decay of MRPs. The photodegradation of MRPs and the formation of new compounds have been studied by fluorescence spectroscopy and nontargeted (ultra)high-resolution mass spectrometry. Photoreactions showed strong selectivity towards the degradation of electron-rich aromatic heterocycles, such as pyrroles and pyrimidines. The data show that oxidative cleavage mechanisms dominate the formation of photoproducts. The photochemical transformations differed fundamentally from "traditional" thermal Maillard reactions and indicated a high amino acid specificity.

Keywords: Maillard reaction; advanced glycation; photochemistry; photooxidation; reactive oxygen species.


Conflict of interest statement

The authors declare no conflict of interest.

Figures

Figure 1
Figure 1
Photolytic degradation of MRPs in three model systems (ribose–lysine, –arginine, and –histidine) heated for ten hours at 100 °C. Excitation–emission matrices retrieved from diluted model systems (1:800 v/v in H2O) (a–c) before irradiation and (d–f) after solar irradiation for 8 h. (g–i) Changes in fluorescence intensity after an irradiation time of 8 h compared to nonradiated samples. All fluorescence intensity values are expressed in quinine sulfate units (ppm).
Figure 2
Figure 2
Four component EEM‐PARAFAC models obtained from EEM measurements. (a) Ribose–lysine, (b) ribose–arginine, and (c) ribose–histidine model systems. All model systems were irradiated for 20 h. EEM spectra were recorded every 20 min.
Figure 3
Figure 3
Changes in the absorption spectra upon irradiation. Differential absorbance spectra of (a) ribose–lysine, (b) ribose–arginine, and (c) ribose–histidine model systems irradiated for eight hours. UV/Vis spectra were recorded every 20 minutes simultaneously with EEMs presented above. Embedded black curves represent UV/Vis absorption spectra of unirradiated model systems (10 h, 100 °C), respectively.
Figure 4
Figure 4
Effect of solar irradiation on elemental compositions of ribose–histidine MRPs. Model systems were irradiated for eight hours and compared to unirradiated control samples. Irradiation experiments were performed in duplicate. Each sample then was analyzed by FT‐ICR‐MS in triplicate injections (N=2×3). Peak intensities of all features found in irradiated samples were compared to the same features in the unirradiated control samples by Student's t‐Test (n=3): Features, which showed a significant decrease in peak intensities in both independent irradiation experiments are colored in blue. Features, which showed a significant increase or were newly formed upon irradiation are highlighted in red, respectively. (a) Volcano plot. (b) Number of molecular formulae showing significant changes in peak intensities. (c) Van Krevelen diagram28 of all significantly affected molecular formulae. Pie charts illustrate the reduced occurrence of nitrogen‐free (CHO) MRPs in photochemical reactions. Black pie chart represents elemental compositions, which did not show a significant change in peak intensities upon irradiation.
Figure 5
Figure 5
Van Krevelen diagram28 of all molecular formulae reproducibly found in two independent replicate experiments (each analyzed in triplicate) after heating a ribose–histidine model system for ten hours at 100 °C. Color indicates the number of nitrogen atoms in the formulae. Scaling is relative to the average peak intensity recorded by FT‐ICR‐MS.
Figure 6
Figure 6
LC‐MS/MS analysis of known AGEs and MRPs that can be formed in the ribose–lysine and –arginine Maillard reaction, respectively. Log2 fold changes represent the changes in peak intensities between irradiated (8 h) and unirradiated control samples. Two independent irradiation experiments (experiment A: dark grey, experiment B: grey) were carried out. Each experiment was analyzed in triplicate injections by LC‐MS/MS.
Figure 7
Figure 7
Overview of compositional descriptors retrieved for the ribose–histidine model system after molecular‐formulae computation from FT‐ICR‐MS data. Bar charts are grouped into features, which showed a significant decrease (blue; log2FC<−1 and p<0.01, Student's t‐Test (n=3)) and significant increase (red; log2FC >1 and p<0.01, Student's t‐Test (n=3)) in peak intensities in both independent irradiation experiments, respectively. Features that did not show a significant change in peak intensities after an irradiation time of eight hours are colored in black. Represented descriptors are (a) number of carbon atoms per formula, (b) measured m/z‐values, (c) number of oxygen atoms per formula, (d) number of nitrogen atoms per formula, (e) number of double bond equivalents per carbon atom, and (f) average carbon oxidation state.
Figure 8
Figure 8
Pairwise comparison of mass difference incidences. Incidence rates were computed from all recorded mass differences in the mass spectra of thermally synthesized MRPs (left panel) and photochemically synthesized products (right panel). The top ten of the most frequently occurring mass differences were assigned to their element compositional equivalents representing possible net chemical transformations. Incidences represent the relative probability by which a monoisotopic signal in the mass spectrum can be linked to another monoisotopic signal with a given mass difference mdi.

References

    1. Hellwig M., Henle T., Angew. Chem. Int. Ed. 2014, 53, 10316–10329; - PubMed
    2. Angew. Chem. 2014, 126, 10482–10496.
    1. Yaylayan V. A., Food Sci. Technol. Res. 2003, 9, 1–6.
    1. Henning C., Glomb M. A., Glycoconjugate J. 2016, 33, 499–512. - PubMed
    1. None
    1. Wang H.-Y., Qian H., Yao W.-R., Food Chem. 2011, 128, 573–584;

LinkOut - more resources