. 2019 Sep 9;58(37):13004-13008.
doi: 10.1002/anie.201905685. Epub 2019 Aug 21.

Direct Visualization of Single Nuclear Pore Complex Proteins Using Genetically-Encoded Probes for DNA-PAINT

Affiliations

Direct Visualization of Single Nuclear Pore Complex Proteins Using Genetically-Encoded Probes for DNA-PAINT

Thomas Schlichthaerle et al. Angew Chem Int Ed Engl. .

Abstract

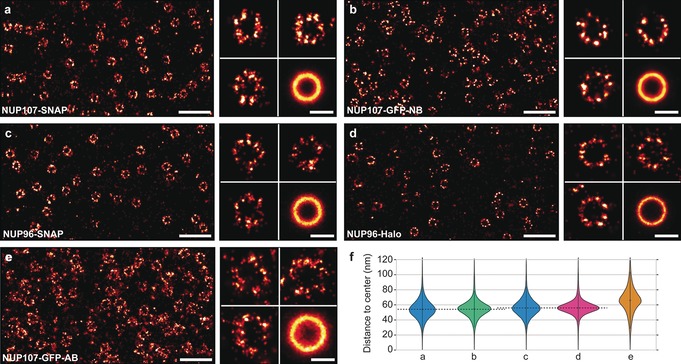
The nuclear pore complex (NPC) is one of the largest and most complex protein assemblies in the cell and, among other functions, serves as the gatekeeper of nucleocytoplasmic transport. Unraveling its molecular architecture and functioning has been an active research topic for decades with recent cryogenic electron microscopy and super-resolution studies advancing our understanding of the architecture of the NPC complex. However, the specific and direct visualization of single copies of NPC proteins is thus far elusive. Herein, we combine genetically-encoded self-labeling enzymes such as SNAP-tag and HaloTag with DNA-PAINT microscopy. We resolve single copies of nucleoporins in the human Y-complex in three dimensions with a precision of circa 3 nm, enabling studies of multicomponent complexes on the level of single proteins in cells using optical fluorescence microscopy.

Keywords: DNA-PAINT; genetically encoded tags; nuclear pore complex; single-molecule imaging; super-resolution microscopy.


Conflict of interest statement

The authors declare no conflict of interest.

Figures

Figure 1
Figure 1
a) Comparison of different labeling probes (secondary antibody: yellow, GFP nanobody: green, HaloTag: magenta, SNAP‐tag: blue) conjugated with DNA strands for DNA‐PAINT imaging (cartoons are based on protein database (PDB) entries: Secondary antibody (1IGT), GFP nanobody (3K1K), HaloTag (4KAF), SNAP‐tag (3KZZ)). Proteins are to scale. b) NPCs contain 16 copies of NUP96 and NUP107 in the cytoplasmic as well as the nuclear ring. Top right: C‐terminally‐labeled (blue, highlighted by green arrows) NUP96 structure (orange) highlighted in the zoom‐in of a symmetry center on the ring (ca. 12 nm apart). Bottom right: N‐terminally‐labeled (blue, highlighted by green arrows), NUP107 structure (orange) in the zoom‐in of a symmetry center on the ring (ca. 12 nm apart). Distances and cartoons derived from PDB entry: Nup(5A9Q). c) DNA‐PAINT overview image of NUP96‐SNAP in U2OS cells. d) Zoom‐in of highlighted area reveals the arrangement of NUP96 in NPCs. e) DNA‐PAINT overview image of NUP107‐GFP in HeLa cells. f) Zoom‐in of highlighted area. Scale bars: 5 μm (c, e), 100 nm (d, f).
Figure 2
Figure 2
a) NUP107‐SNAP overview image (left). Zoom‐in to individual NPCs and sum image (n=398) (right). b) NUP107‐GFP nanobody overview image (left). Zoom‐in to individual NPCs and sum image (n=486) (right). c) NUP96‐SNAP overview image (left). Zoom‐in to individual NPCs and sum image (n=288) (right). d) NUP96‐Halo overview image (left). Zoom‐in to individual NPCs and sum image (n=191) (right). e) NUP107‐GFP‐Antibody overview image (left). Zoom‐in to individual NPCs and sum image (n=185) (right). f) Violin plots of the distances between ring center and localizations. Median radii and standard deviation were obtained for each label: NUP107‐SNAP (from a, 127 773 fitted localizations, 53.7±13.1 nm radius), NUP107‐GFP (from b, 219 398 fitted localizations, 54.6±11.9 nm radius), NUP96‐SNAP (from c, 57 297 fitted localizations, 55.9±12.6 nm), NUP96‐Halo (from d, 45 143 fitted localizations, 56.2±10.2 nm radius), NUP107‐GFP‐Anitbody (from e, 69 834 fitted localizations, 65.9±17.5 nm). See also Supplementary Table 2 in in the Supporting Information. Scale bars: 500 nm (overviews), 100 nm (individual NPCs and sum image).
Figure 3
Figure 3
a) Overview image of NUP96‐Halo imaged using 3D DNA‐PAINT (color indicates height, range: −200 (blue) to 200 nm (red)). b) Selection of single NPCs. Arrows are highlighting two copies of NUP96 proteins in the same symmetry center of the same ring (that is at the same height) spaced ca. 12 nm apart from each other (color indicates height, range: −100 (blue) to 100 nm (red)). c) Cross‐sectional histogram of 3D‐summed pairs (n=45) of NUP96 proteins in single symmetry centers as highlighted by arrows in b yields ca.12 nm distance between single proteins. d) NUP96‐Halo‐labeled NPCs show the typical eightfold symmetry (xy‐projection, left) and the organization in nuclear and cytoplasmic rings (xz‐projection, right). Micrographs represent sum data from aligned NPCs (n=31). Bottom: Cross‐sectional histogram of localizations in the xz‐projection yields ca. 61 nm separation between cytoplasmic and nuclear rings. Scale bars: 2 μm (a), 50 nm (b, d).

References

    1. None
    1. Sahl S. J., Hell S. W., Jakobs S., Nat. Rev. Mol. Cell Biol. 2017, 18, 685–701; - PubMed
    1. Sauer M., Heilemann M., Chem. Rev. 2017, 117, 7478–7509. - PubMed
    1. None
    1. Dai M., Jungmann R., Yin P., Nat. Nanotechnol. 2016, 11, 798–807; - PMC - PubMed

Publication types

LinkOut - more resources