

Staging β-Amyloid Pathology With Amyloid Positron Emission Tomography
- PMID: 31314895
- PMCID: PMC6646987
- DOI: 10.1001/jamaneurol.2019.2214
Staging β-Amyloid Pathology With Amyloid Positron Emission Tomography
Abstract
Importance: Different brain regions appear to be involved during β-amyloid (Aβ) accumulation in Alzheimer disease (AD), but a longitudinally valid system to track Aβ stages in vivo using positron emission tomography (PET) is lacking.
Objective: To construct a longitudinally valid in vivo staging system for AD using amyloid PET.
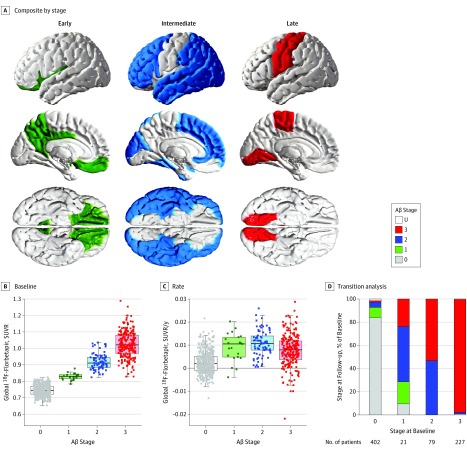
Design, setting, and participants: Longitudinal multicenter cohort study using data accessed on August 20, 2018, from the Alzheimer's Disease Neuroimaging Initiative database of scans performed from June 9, 2010, to July 12, 2018, from 741 persons: 304 without cognitive impairment, 384 with mild cognitive impairment, and 53 with AD dementia. Cerebrospinal fluid (CSF) Aβ42 and fluorine 18-labeled florbetapir (18F-florbetapir) data were used to determine early, intermediate, and late regions of Aβ accumulation. β-Amyloid stages ranging from 0 to 3 were constructed using these composites. Each subsequent stage required involvement of more advanced regions. Patients were followed up at 2, 4, and 6 years. Replication and validation were conducted using an independent cohort (Swedish BioFINDER) and gene expression information from the Allen Human Brain Atlas database. Analyses were conducted August 21, 2018, to May 24, 2019.
Main outcomes and measures: The main outcome was change in stage. Stages were compared for diagnosis, CSF biomarkers of tau, and longitudinal atrophy, cognitive measures, and regional gene expression. Transitions between stages were tested using longitudinal 18F-florbetapir data.
Results: Among 641 participants with CSF Aβ42 data and at least two 18F-florbetapir scans, 335 (52.3%) were male. The early region of Aβ accumulation included the precuneus, posterior cingulate, isthmus cingulate, insula, and medial and lateral orbitofrontal cortices. The late region included the lingual, pericalcarine, paracentral, precentral, and postcentral cortices. The intermediate region included remaining brain regions with increased accumulation rates. In 2072 PET scans from 741 participants, 2039 (98.4%) were unambiguously staged. At baseline, participants with stage 0 (n = 402) had a 14.7% (95% CI, 11.2%-18.1%) probability of progression to a higher stage; stage 1 (n = 21), 71.4% (95% CI, 50.0%-90.9%); and stage 2 (n = 79), 53.1% (95% CI, 42.2%-64.0%). Seven of the 741 participants (0.9%) reverted to a lower stage. Higher stages were associated with lower CSF Aβ42 concentrations (from stage 1 at baseline), greater CSF P-tau (from stage 1) and CSF T-tau (from stage 2), and accelerated cognitive decline (from stage 2) and atrophy (from stage 3), even when adjusting for clinical diagnosis. Key findings were replicated in the BioFINDER cohort (N = 474). The regions of different stages differed by gene expression profiles when using the transcriptome from the Allen Human Brain Atlas, especially involving genes associated with voltage-gated ion channel activity especially involving genes associated with voltage-gated ion channel activity, but also blood circulation, axon guidance, and lipid transportation.
Conclusions and relevance: Results of this study suggest that this robust staging system of Aβ accumulation may be useful for monitoring patients throughout the course of AD. Progression through stages may depend on underlying selective vulnerability in different brain regions.
Conflict of interest statement
Figures

References
-
- Villemagne VL, Burnham S, Bourgeat P, et al. ; Australian Imaging Biomarkers and Lifestyle (AIBL) Research Group . Amyloid β deposition, neurodegeneration, and cognitive decline in sporadic Alzheimer’s disease: a prospective cohort study. Lancet Neurol. 2013;12(4):357-367. doi: 10.1016/S1474-4422(13)70044-9 - DOI - PubMed
LinkOut - more resources
Full Text Sources
Other Literature Sources
