. 2019 Jul 16;28(3):819-831.e4.
doi: 10.1016/j.celrep.2019.06.049.

Comprehensive Immune Monitoring of Clinical Trials to Advance Human Immunotherapy

Affiliations

Comprehensive Immune Monitoring of Clinical Trials to Advance Human Immunotherapy

Felix J Hartmann et al. Cell Rep. .

Abstract

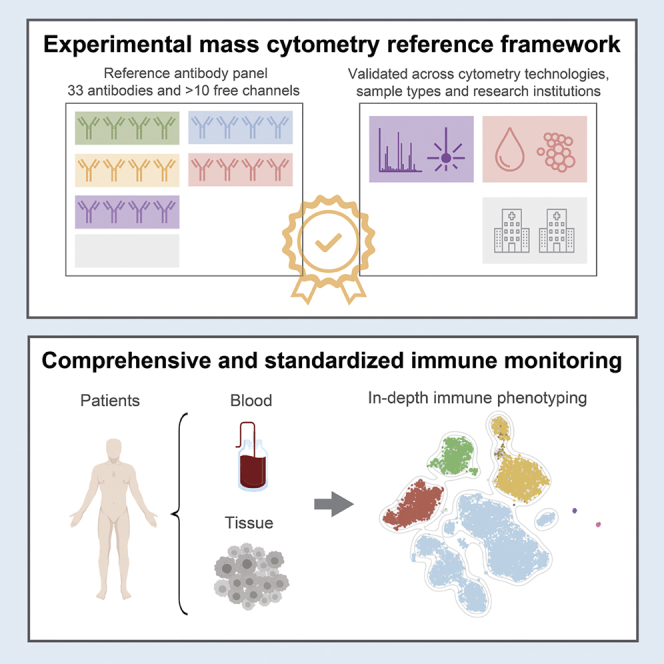
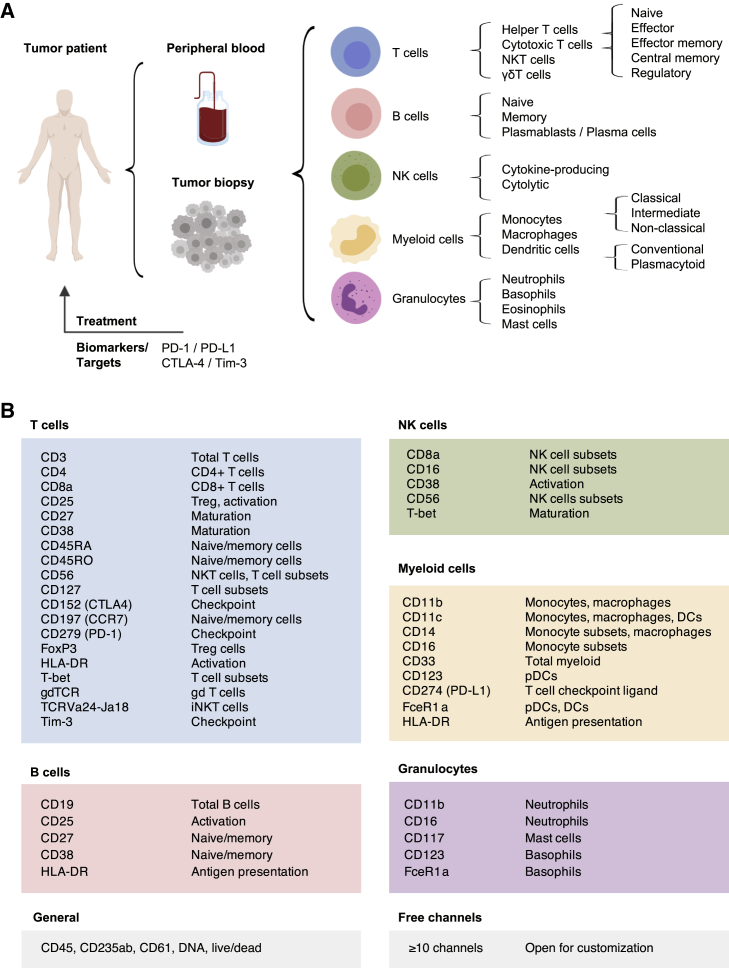
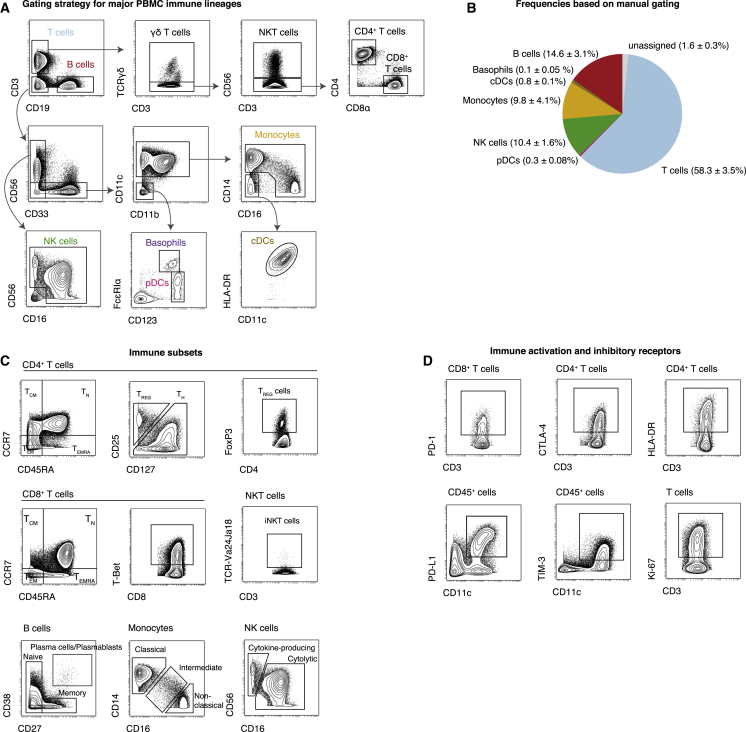
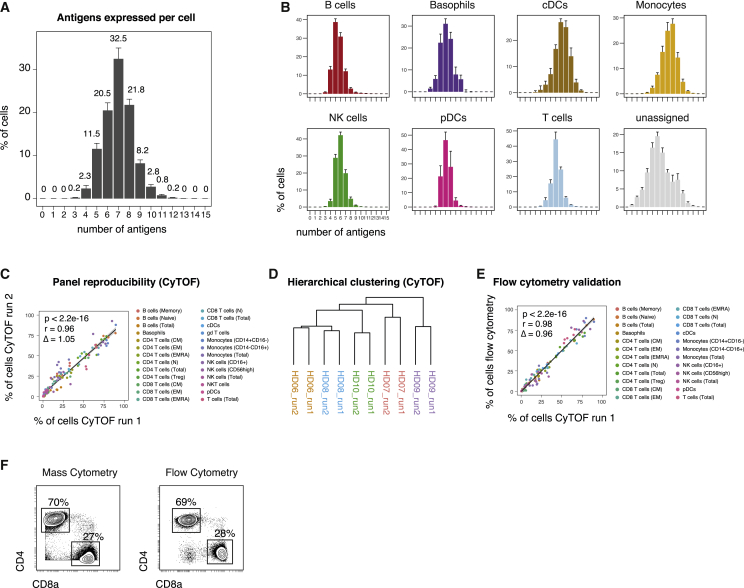
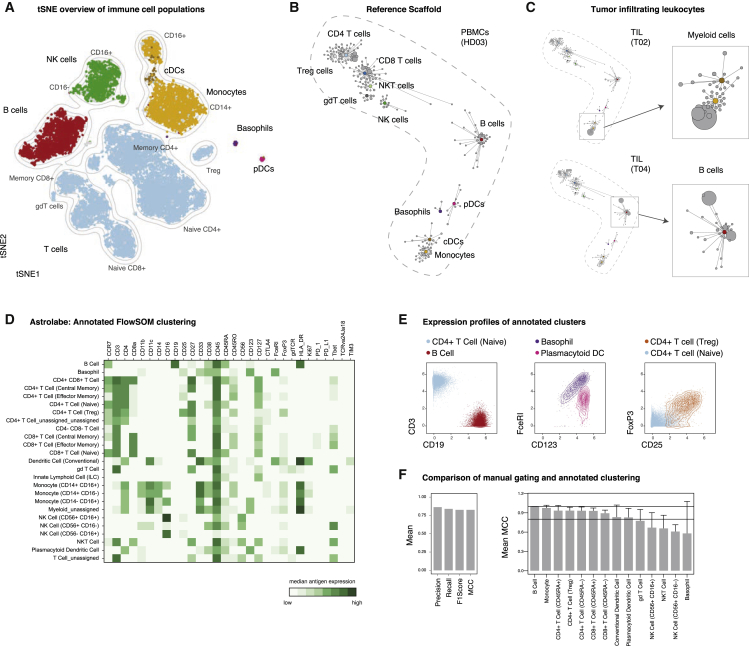
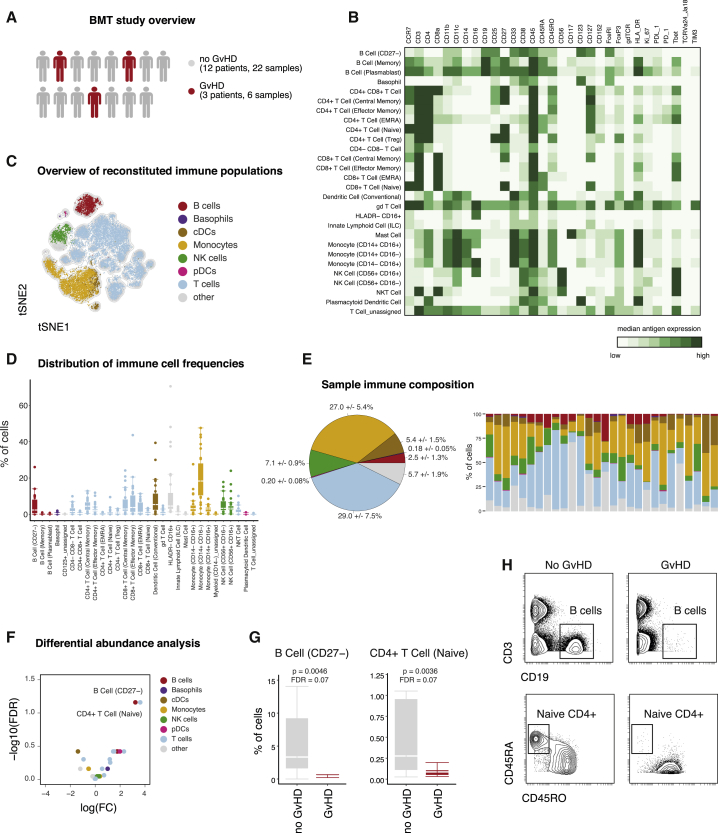
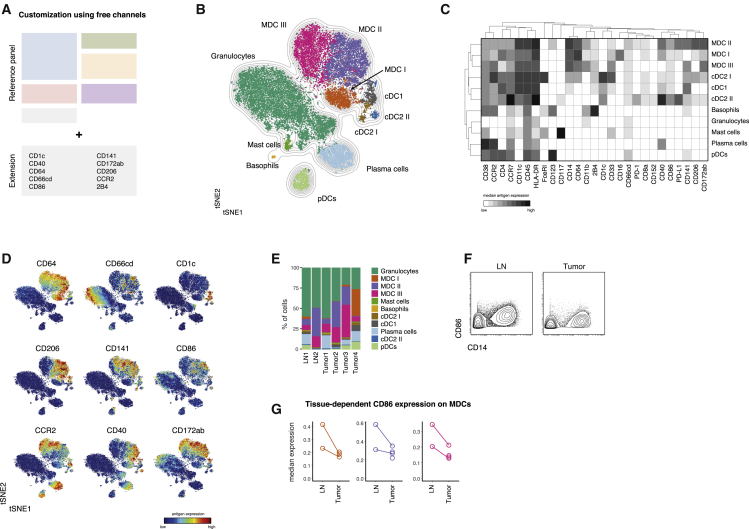
The success of immunotherapy has led to a myriad of clinical trials accompanied by efforts to gain mechanistic insight and identify predictive signatures for personalization. However, many immune monitoring technologies face investigator bias, missing unanticipated cellular responses in limited clinical material. We present here a mass cytometry (CyTOF) workflow for standardized, systems-level biomarker discovery in immunotherapy trials. To broadly enumerate immune cell identity and activity, we established and extensively assessed a reference panel of 33 antibodies to cover major cell subsets, simultaneously quantifying activation and immune checkpoint molecules in a single assay. This assay enumerates ≥98% of peripheral immune cells with ≥4 positively identifying antigens. Robustness and reproducibility are demonstrated on multiple samples types, across two research centers and by orthogonal measurements. Using automated analysis, we identify stratifying immune signatures in bone marrow transplantation-associated graft-versus-host disease. Together, this validated workflow ensures comprehensive immunophenotypic analysis and data comparability and will accelerate biomarker discovery.

Keywords: CyTOF; biomarker; bone marrow transplantation; cancer; immunotherapy; mass cytometry; monitoring; phenotyping.


Conflict of interest statement

E.-A.D.A. is a co-founder of Astrolabe Diagnostics, Inc. The other authors declare no competing interests.

Figures

None
Graphical abstract
Figure 1
Figure 1
Comprehensive Assessment of Immune Composition for Clinical Research in Cancer Immunotherapy (A) Common sample types anticipated from tumor patients include peripheral blood samples and tumor biopsies. Within these samples, immune cell lineages and respective subpopulations are indicated. Although more subsets can be delineated, these populations were chosen as a reference set of interest for comprehensive immunophenotyping. In addition to population identification, important clinical targets and currently available biomarkers are of high interest. (B) Antigens were selected based on their relevance for population and subpopulation identification or for defining important activation and/or maturation stages. For additional information on clones, dilutions, and metal-assignments, see Table S1 and the Key Resources Table.
Figure 2
Figure 2
Data Exploration and Identification of Immune Cell Subsets in Peripheral Blood PBMCs were stained with the indicated set of antibodies (see Table S1) and analyzed by mass cytometry. (A) Cells were pre-gated as non-beads, DNA+, single, live, CD45+, CD235ab/CD61, non-neutrophils (see Figure S1). The major immune lineages and certain subsets are identified through the indicated series of gating steps. (B) Median frequencies ± SEM in PBMCs from healthy donors (n = 5). (C) Exemplary identification of immune cell subsets, pre-gated on the indicated populations. Treg cells can be identified as CD25high CD127low, FoxP3pos, or a combination thereof. (D) Assessment of expression levels of important checkpoint and activation molecules on various immune cell populations. Expression was induced by stimulating cells with anti-CD3, anti-CD28-coated beads for 2 days.
Figure 3
Figure 3
Reproducible Assessments of Immune Composition across Independent Analyses PBMCs from healthy donors (n = 5) were analyzed in two research centers. Immune cell populations were identified through serial gating as before (see Figure 2). (A) Median number of positive antigens per cell, based on manually determined cutoffs (see Figure S2A). Numbers indicate median frequency of total pre-gated cells. Error bars represent SEM. (B) Median number of positive antigens per cell as in (A), stratified by immune cell lineage. (C) Different PBMC aliquots of the same donors (n = 5) were stained and acquired by mass cytometry in two different research institutes. Frequencies of immune lineages were determined through serial gating. Linear regression line is shown in black with the 95% confidence intervals (CIs, shaded). Coefficients, p values, and slope Δ were calculated based on data from all donors. (D) Hierarchical clustering of samples from two independent mass cytometry runs based on frequencies as in (C). (E) PBMCs aliquots of the same donors as in (C) were stained and acquired by flow cytometry, employing four separate staining reactions. Frequencies of immune lineages were determined through serial gating and plotted against the frequencies determined from mass cytometry as in (C). Linear regression line is shown in black with the 95% CIs (shaded). Coefficients, p values, and slope Δ were calculated based on data from all five donors. (F) Exemplary biaxial plots and frequencies of CD4+ and CD8+ T cell subsets within one donor (HD08), as determined by mass cytometry (left) and flow cytometry (right).
Figure 4
Figure 4
Automated Data Visualization and Population Identification PBMCs from healthy subjects (n = 5) and tumor biopsies from cancer patients (n = 5) were analyzed by mass cytometry using the reference panel (see Table S1). (A) Data from all healthy donors was randomly subsampled to 20,000 cells and subjected to tSNE dimensionality reduction. Cells are colored by their immune cell lineage assignment from manual gating. Grey indicates cells unassigned by manual gating. (B) A reference scaffold map of PBMC data was created using manually gated landmarks (colored) and all antigens for the clustering analysis. Inter-cluster connections were used to create the graph but are not depicted here. Shown is one representative sample (HD03). (C) Pre-gated, CD45+ cells from tumor samples were mapped onto the reference scaffold. Maps from two patients are shown (left). Enlarged examples of modulated immune cell populations are pointed out (right). (D) PBMC data as above were clustered and automatically annotated using the Astrolabe platform. Shown are median expression levels of all antigens for all clusters. (E) Exemplary expression profiles of immune cell populations as determined by Astrolabe (HD06). (F) Mean precision, recall, F1score, and Matthews correlation coefficient (MCC; see Method Details) between manual lineage assignments and FlowSOM-based clustering for all donors and populations (left). Mean MCC for all donors stratified by population (right). Two horizontal lines indicate MCC = 1 (maximum agreement) and MCC = 0.8, respectively. Error bars represent SEM.
Figure 5
Figure 5
Identification of Disease-Associated Immune Signatures Following Bone Marrow Transplantation (A) Following tumor therapy, patients (n = 15; Table S2) underwent bone marrow transplantation. Peripheral blood samples were collected and subsequently stained with the described reference panel and analyzed by mass cytometry. (B) Data were uploaded to the Astrolabe platform, clustered, and automatically annotated. Exemplary heatmap of one patient depicting the median protein expression levels across all populations identified through clustering. (C) The 20,000 randomly subsampled cells of one patient were subjected to tSNE dimensionality reduction. Color-assignments represent different immune lineages as identified through annotated clustering. (D) Clustering-derived frequencies of immune populations for all samples in this study (n = 28). Boxplots depict the interquartile range (IQR) with a horizontal line representing the median. Whiskers extend to the farthest data point within a maximum of 1.5× IQR. Points represent individual samples. (E) Frequencies of immune cell subpopulations were combined into frequencies for major immune cell lineages and color-coded as in (C). Pie chart depicting the median frequencies ± SEM of all major immune lineages across all samples (left). Immune composition for all analyzed samples (n = 28; right). (F) FDR and fold change (FC) of immune cell frequencies in patients with or without GvHD. (G) Comparison of differentially abundant immune cell frequencies in patients with or without GvHD. Boxplots depict the IQR with a horizontal line representing the median. (H) Confirmation of reduced abundance of B cells (top) and naive CD4+ T cells (bottom) in an exemplary patient with (right) and without (left) GvHD. Examples of B cells were pre-gated on single, live, CD45+ cells. Examples of naive CD4+ T cells were pre-gated on single, live, CD4+ T cells.
Figure 6
Figure 6
Flexibility of the Proposed Framework Enables Augmented Exploration of Heterogeneous Populations (A) Antibodies targeting additional antigens of interest were conjugated to non-occupied heavy metal isotopes (see Table S3). Cells from lymph node biopsies (n = 2) and tumor biopsies (n = 4) of patients with head and neck carcinoma (see Table S2) were stained with these antibodies in combination with the reference set. (B) Data were pre-gated on single, live, CD45+CD3CD19CD7CD56 to exclude T cells, most B cells, and NK cells. To create a tSNE overview, data from all samples were randomly subsampled to 20,000 cells with equal contribution from all samples. Cells are colored by their FlowSOM-based cluster-assignment. Grey lines indicate the density distribution of the tSNE map. (C) Cluster-based median expression levels for all population-relevant antigens used in the tSNE and FlowSOM analysis. (D) Protein expression levels of all additional antigens are overlaid as a color-dimension onto the tSNE map. (E) Frequencies of FlowSOM-based clusters as in (B) and (C) in all samples. (F) Exemplary CD86 expression levels on total MDCs (CD14+ cells) in cells derived from a lymph node metastasis (left) and primary tumor (right) of the same patient. (G) Median CD86 expression levels (arcsinh-transformed and percentile normalized) on MDC subsets from lymph nodes and tumors. Lines connect different tissues of the same patients.

References

    1. Amir A.D., Davis K.L., Tadmor M.D., Simonds E.F., Levine J.H., Bendall S.C., Shenfeld D.K., Krishnaswamy S., Nolan G.P., Pe’er D. viSNE enables visualization of high dimensional single-cell data and reveals phenotypic heterogeneity of leukemia. Nat. Biotechnol. 2013;31:545–552. - PMC - PubMed
    1. Arvaniti E., Claassen M. Sensitive detection of rare disease-associated cell subsets via representation learning. Nat. Commun. 2017;8:14825. - PMC - PubMed
    1. Bandura D.R., Baranov V.I., Ornatsky O.I., Antonov A., Kinach R., Lou X., Pavlov S., Vorobiev S., Dick J.E., Tanner S.D. Mass cytometry: technique for real time single cell multitarget immunoassay based on inductively coupled plasma time-of-flight mass spectrometry. Anal. Chem. 2009;81:6813–6822. - PubMed
    1. Becht E., McInnes L., Healy J., Dutertre C.-A., Kwok I.W.H., Ng L.G., Ginhoux F., Newell E.W. Dimensionality reduction for visualizing single-cell data using UMAP. Nat. Biotechnol. 2018;37:38–44. - PubMed
    1. Bendall S.C., Simonds E.F., Qiu P., Amir A.D., Krutzik P.O., Finck R., Bruggner R.V., Melamed R., Trejo A., Ornatsky O.I. Single-cell mass cytometry of differential immune and drug responses across a human hematopoietic continuum. Science. 2011;332:687–696. - PMC - PubMed

Publication types