. 2019 Jul 16;11(7):344.
doi: 10.3390/pharmaceutics11070344.

In Vitro-In Vivo Correlations Based on In Vitro Dissolution of Parent Drug Diltiazem and Pharmacokinetics of its Metabolite

Affiliations

In Vitro-In Vivo Correlations Based on In Vitro Dissolution of Parent Drug Diltiazem and Pharmacokinetics of its Metabolite

Constantin Mircioiu et al. Pharmaceutics. .

Abstract

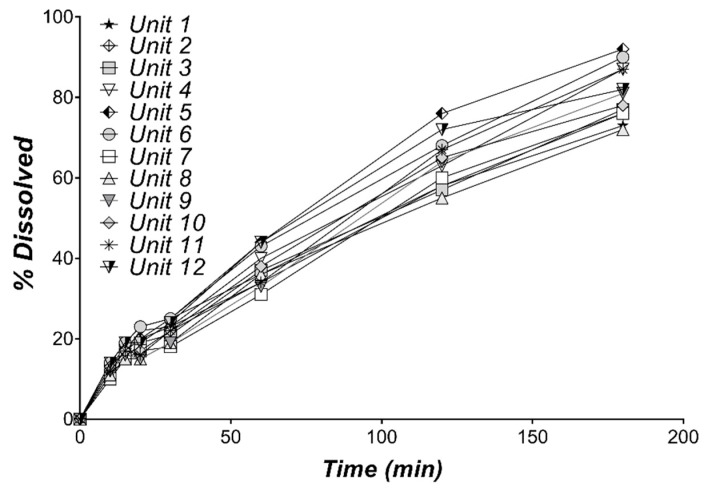
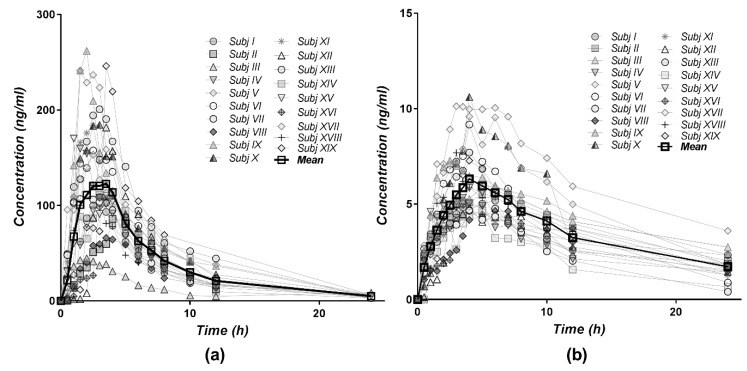
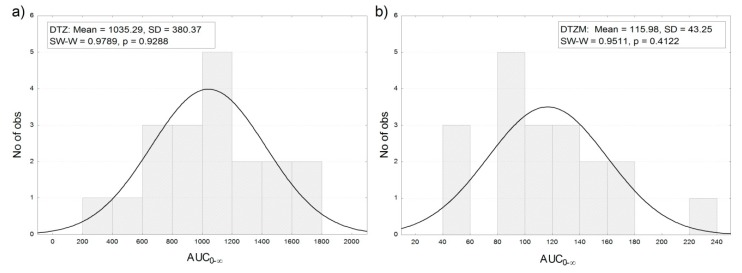
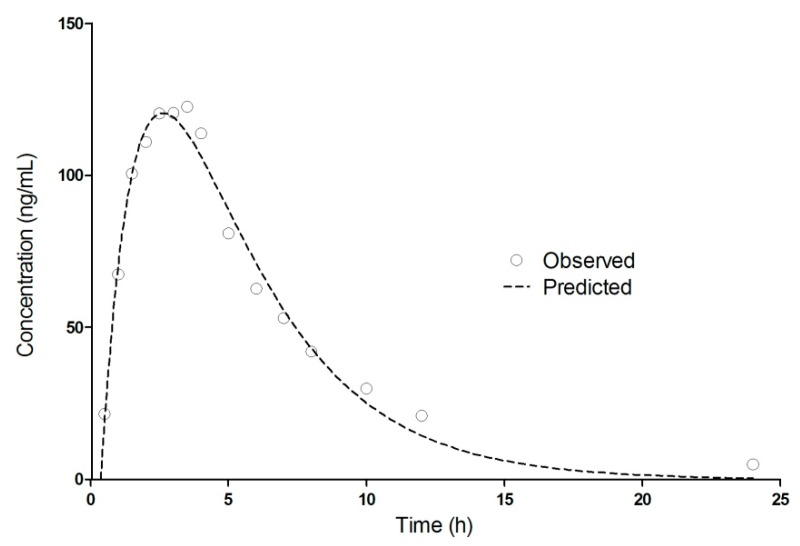
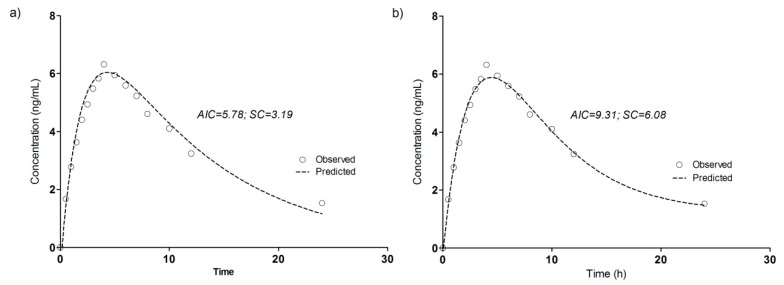
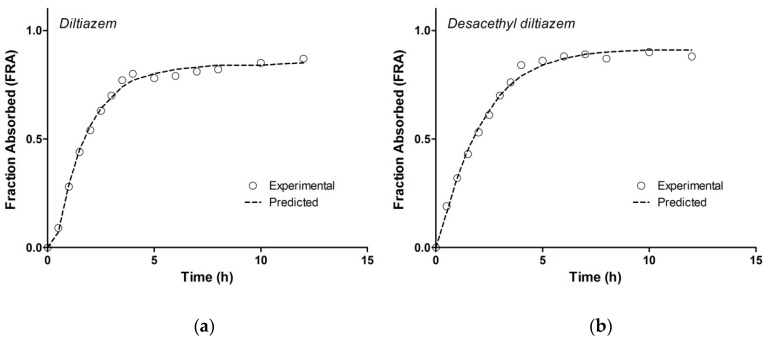
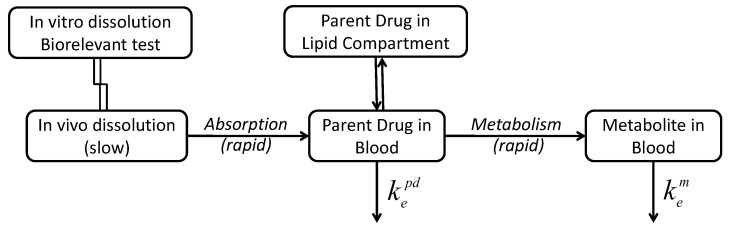
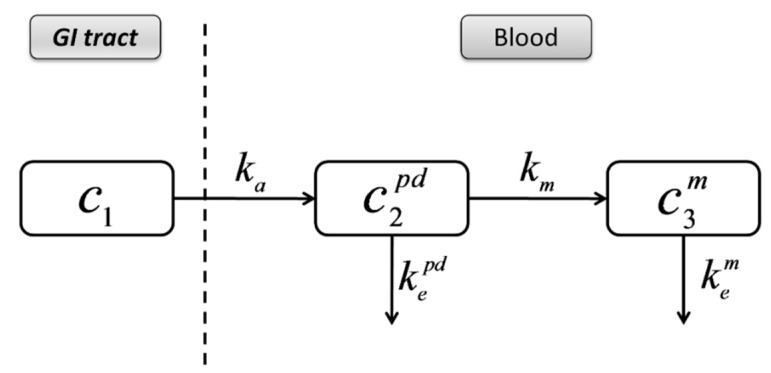
In this study a novel type of in vitro-in vivo correlation (IVIVC) is proposed: The correlation of the in vitro parent drug dissolution data with the in vivo pharmacokinetic data of drug's metabolite after the oral administration of the parent drug. The pharmacokinetic data for the parent drug diltiazem (DTZ) and its desacetyl diltiazem metabolite (DTZM) were obtained from an in vivo study performed in 19 healthy volunteers. The pharmacokinetics of the parent drug and its metabolite followed a pseudomono-compartmental model and deconvolution of the DTZ or DTZM plasma concentration profiles was performed with a Wagner-Nelson-type equation. The calculated in vivo absorption fractions were correlated with the in vitro DTZ dissolution data obtained with USP 2 apparatus. A linear IVIVC was obtained for both DTZ and DTZM, with a better correlation observed for the case of the metabolite. This type of correlation of the in vitro data of the parent compound with the in vivo data of the metabolite could be useful for the development of drugs with active metabolites and prodrugs.

Keywords: diltiazem; dissolution; in vitro–in vivo correlation (IVIVC); mathematical modeling; metabolites.


Conflict of interest statement

Mircioiu, C.; Ionica, G.; Danilceac, A.; Miron, D.; Mircioiu, I.; Radulescu, F.S. Pharmacokinetic and mathematical outliers for drugs with active metabolites. Note i. Model independent analyses for pentoxifylline. FARMACIA 2010, 58, 264–278.

Figures

Figure 1
Figure 1
Individual in vitro dissolution profiles of DTZ from 60 mg Cardiazem® tablets in 900 mL water, using USP Apparatus 2, at 75 rpm (n = 12).
Figure 2
Figure 2
Typical HPLC chromatograms of DTZ and DTZM in plasma: (a) Chromatogram of a standard sample containing DTZ (500 ng/mL) and DTZM (250 ng/mL) and internal standard (IS); (b) chromatogram of blank plasma; (c) chromatogram of a plasma sample obtained from one on the study subjects two hours after drug administration (DTZ—154.4 ng/mL, DTZM—3.9 ng/mL).
Figure 3
Figure 3
Individual and mean plasma concentration–time profiles for (a) DTZ and (b) DTZM after single dose oral administration of 120 mg diltiazem (2 × 60 mg Cardiazem® tablets) to 19 healthy subjects.
Figure 4
Figure 4
Frequency distribution of AUC0–∞ for (a) DTZ and (b) DTZM after the oral administration of 120 mg of DTZ in 19 healthy subjects (the observed significance level p of the Shapiro–Wilk statistic W (SW–W) indicates normality of the distribution (p < 0.05)).
Figure 5
Figure 5
One-compartment pharmacokinetic modeling of DTZ mean plasma levels after oral administration of 120 mg DTZ (2 × 60 mg Cardiazem® tablets) in 19 healthy subjects.
Figure 6
Figure 6
Pharmacokinetic modeling of DTZM mean plasma levels after oral administration of 120 mg DTZ (2 × 60 mg Cardiazem® tablets) in 19 healthy subjects. (a) One-compartment model; (b) two-compartment model.
Figure 7
Figure 7
Fraction absorbed profiles calculated for (a) DTZ and (b) DTZM; observed: profiles calculated based on estimation of elimination rate constant with non-compartmental analysis, predicted: profiles calculated based on estimation of elimination rate constant with one-compartmental pharmacokinetic modeling.
Figure 8
Figure 8
In vitro–in vivo correlation (IVIVC) model for DTZ (■) and DTZM (formula image).
Figure 9
Figure 9
Schematic of processes involved in the pharmacokinetics of drugs that undergo substantial metabolism.
Figure 10
Figure 10
Simplified compartmental model describing the pharmacokinetics of DTZ and DTZM.

References

    1. Humbert H., Bosshardt H., Cabiac M.-D., Cabiac M. In Vitro-in Vivo Correlation of a Modified-Release Oral Form of Ketotifen: In Vitro Dissolution Rate Specification. J. Pharm. Sci. 1994;83:131–136. doi: 10.1002/jps.2600830205. - DOI - PubMed
    1. Eddington N.D., Marroum P., Uppoor R., Hussain A., Augsburger L. Development and Internal Validation of an In Vitro-in Vivo Correlation for a Hydrophilic Metoprolol Tartrate Extended Release Tablet Formulation. Pharm. Res. 1998;15:466–473. doi: 10.1023/A:1011988601696. - DOI - PubMed
    1. Mahayni H., Rekhi G., Uppoor R., Marroum P., Hussain A., Augsburger L., Eddington N. Evaluation of “External” Predictability of an In Vitro–In Vivo Correlation for an Extended-Release Formulation Containing Metoprolol Tartrate. J. Pharm. Sci. 2000;89:1354–1361. doi: 10.1002/1520-6017(200010)89:10<1354::AID-JPS13>3.0.CO;2-P. - DOI - PubMed
    1. Takka S., Rajbhandari S., Sakr A. Effect of anionic polymers on the release of propranolol hydrochloride from matrix tablets. Eur. J. Pharm. Biopharm. 2001;52:75–82. doi: 10.1016/S0939-6411(01)00147-3. - DOI - PubMed
    1. Emami J. In vitro-in vivo correlation: From theory to applications. J. Pharm. Pharm. Sci. 2006;9:169–189. - PubMed

LinkOut - more resources