. 2019 Sep 17;140(12):1015-1030.
doi: 10.1161/CIRCULATIONAHA.119.039710. Epub 2019 Jul 18.

Disruption of Ca2+i Homeostasis and Connexin 43 Hemichannel Function in the Right Ventricle Precedes Overt Arrhythmogenic Cardiomyopathy in Plakophilin-2-Deficient Mice

Affiliations

Disruption of Ca2+i Homeostasis and Connexin 43 Hemichannel Function in the Right Ventricle Precedes Overt Arrhythmogenic Cardiomyopathy in Plakophilin-2-Deficient Mice

Joon-Chul Kim et al. Circulation. .

Abstract

Background: Plakophilin-2 (PKP2) is classically defined as a desmosomal protein. Mutations in PKP2 associate with most cases of gene-positive arrhythmogenic right ventricular cardiomyopathy. A better understanding of PKP2 cardiac biology can help elucidate the mechanisms underlying arrhythmic and cardiomyopathic events consequent to PKP2 deficiency. Here, we sought to capture early molecular/cellular events that can act as nascent arrhythmic/cardiomyopathic substrates.

Methods: We used multiple imaging, biochemical and high-resolution mass spectrometry methods to study functional/structural properties of cells/tissues derived from cardiomyocyte-specific, tamoxifen-activated, PKP2 knockout mice (PKP2cKO) 14 days post-tamoxifen injection, a time point preceding overt electrical or structural phenotypes. Myocytes from right or left ventricular free wall were studied separately.

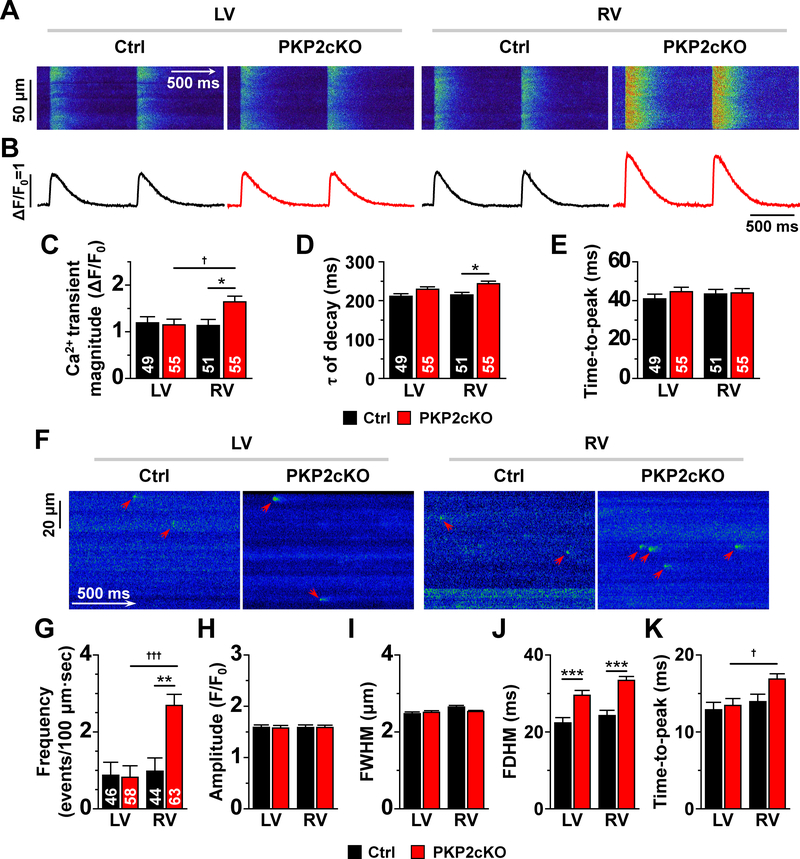
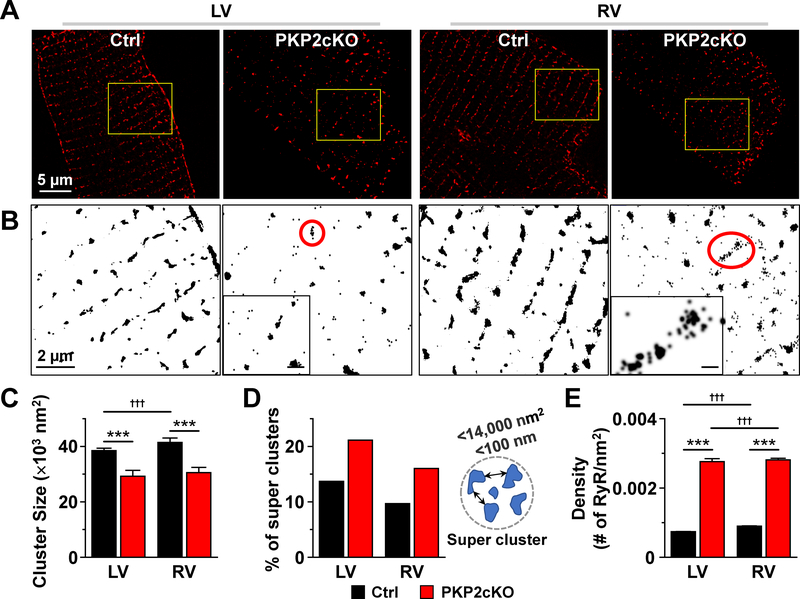
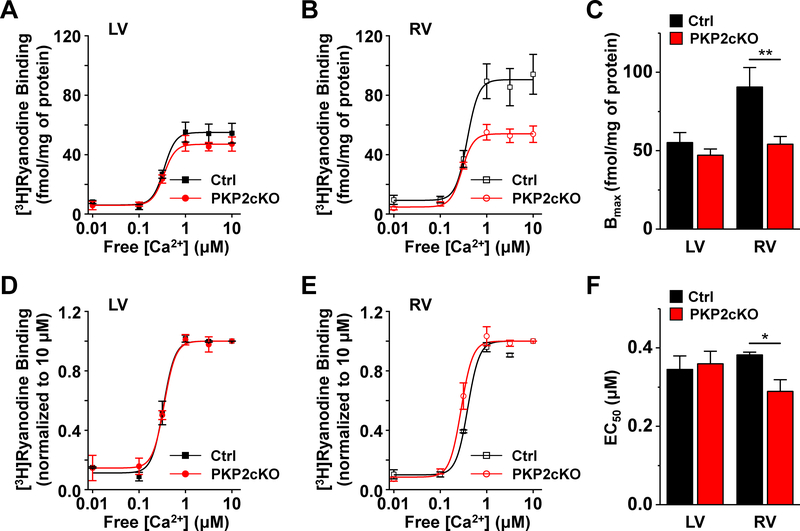
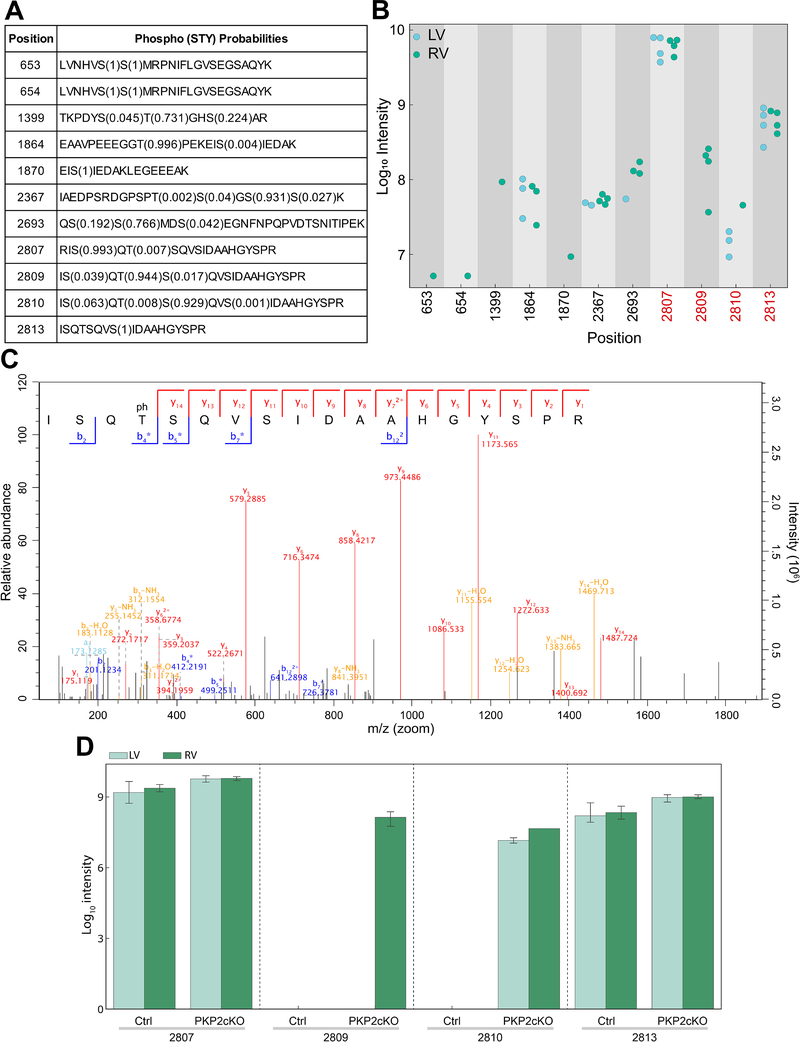
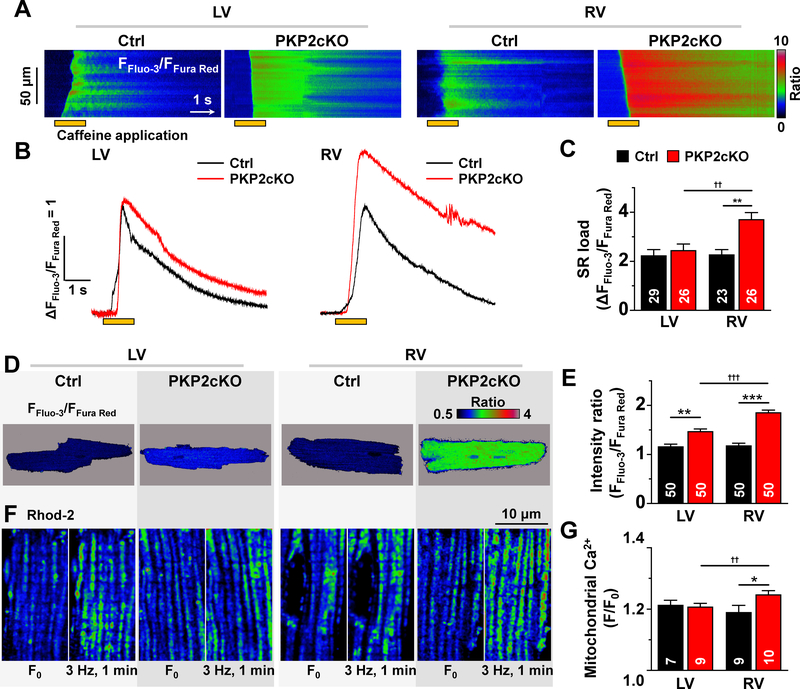
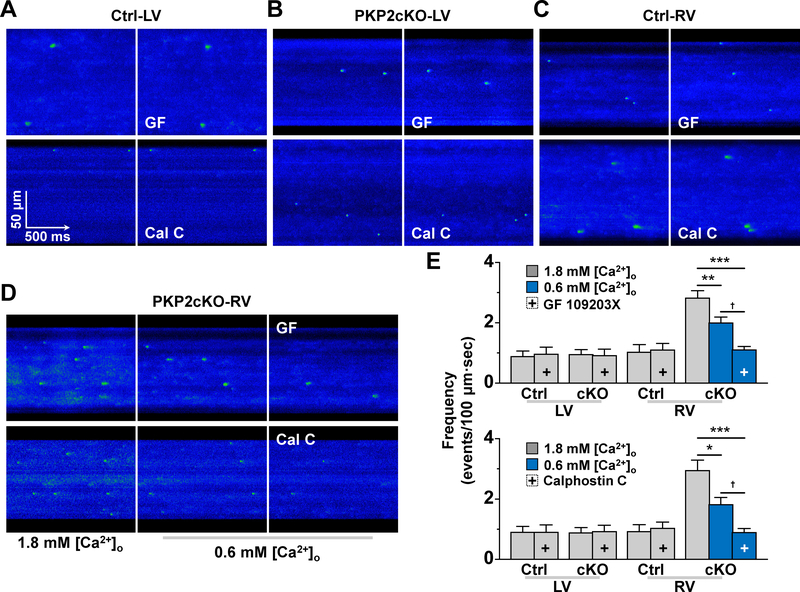
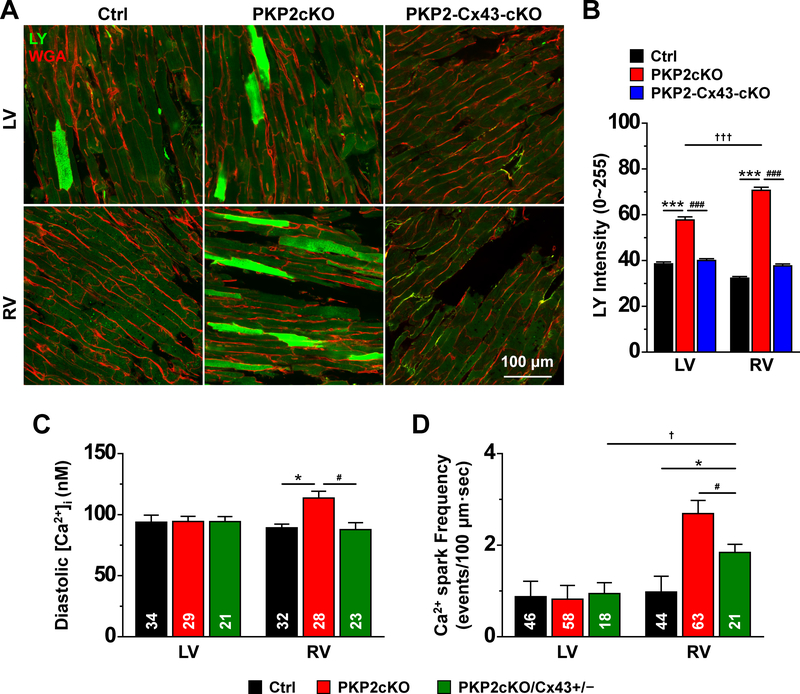
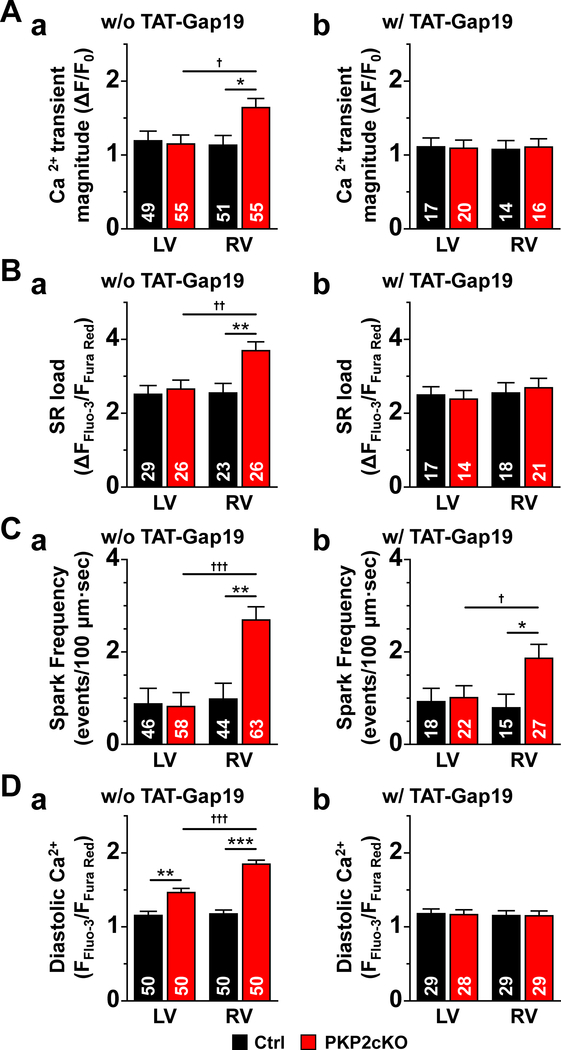
Results: Most properties of PKP2cKO left ventricular myocytes were not different from control; in contrast, PKP2cKO right ventricular (RV) myocytes showed increased amplitude and duration of Ca2+ transients, increased Ca2+ in the cytoplasm and sarcoplasmic reticulum, increased frequency of spontaneous Ca2+ release events (sparks) even at comparable sarcoplasmic reticulum load, and dynamic Ca2+ accumulation in mitochondria. We also observed early- and delayed-after transients in RV myocytes and heightened susceptibility to arrhythmias in Langendorff-perfused hearts. In addition, ryanodine receptor 2 in PKP2cKO-RV cells presented enhanced Ca2+ sensitivity and preferential phosphorylation in a domain known to modulate Ca2+ gating. RNAseq at 14 days post-tamoxifen showed no relevant difference in transcript abundance between RV and left ventricle, neither in control nor in PKP2cKO cells. Instead, we found an RV-predominant increase in membrane permeability that can permit Ca2+ entry into the cell. Connexin 43 ablation mitigated the membrane permeability increase, accumulation of cytoplasmic Ca2+, increased frequency of sparks and early stages of RV dysfunction. Connexin 43 hemichannel block with GAP19 normalized [Ca2+]i homeostasis. Similarly, protein kinase C inhibition normalized spark frequency at comparable sarcoplasmic reticulum load levels.

Conclusions: Loss of PKP2 creates an RV-predominant arrhythmogenic substrate (Ca2+ dysregulation) that precedes the cardiomyopathy; this is, at least in part, mediated by a Connexin 43-dependent membrane conduit and repressed by protein kinase C inhibitors. Given that asymmetric Ca2+ dysregulation precedes the cardiomyopathic stage, we speculate that abnormal Ca2+ handling in RV myocytes can be a trigger for gross structural changes observed at a later stage.

Keywords: arrhythmogenic right ventricular cardiomyopathy; connexin43; plakophilin 2; right ventricle; sudden death.


Conflict of interest statement

DISCLOSURE

None.

Figures

Figure 1.
Figure 1.. Ca2+ transients and Ca2+ sparks in RV and LV myocytes from control and PKP2cKO hearts.
Time-space plots (A) and time course of Ca2+ transients (B) obtained by line-scans (1.43 ms/line) during field stimulation (1 Hz) of myocytes isolated from the left ventricle (LV) and right ventricle (RV) of control (Ctrl) and plakophilin-2 conditional knockout (PKP2cKO) mice. Panels C-E show compiled data for mean Ca2+ transient magnitude (relative amplitude; ΔF/F0; C), time constant of Ca2+ transient decay (ms; D) and time-to-peak (ms; E). Black and red bars depict data from Ctrl and PKP2cKO myocytes, respectively. Panel F: confocal line-scan images of Ca2+ sparks (green; emphasized by red arrowheads) recorded from control (Ctrl) and PKP2cKO myocytes isolated from either LV or RV. Cumulative data are shown in panels G-K. Black and red bars represent data obtained from control and PKP2cKO mice, respectively. G: Mean frequency of Ca2+ sparks, reported as average number of events per second in a 100 μm line. H: Average peak amplitude (F/F0). I: full-width at half maximum (FWHM; μm). J: full duration at half maximum (FDHM; ms). K: time-to-peak (ms). For all bar graphs: black, control; red, PKP2cKO. Number of cells studied are noted in the corresponding bars. For panels C-E: Statistical tests: Hierarchical test was first attempted. Output indicated whether to proceed via two-way repeated measures analysis of variance (ANOVA)-Bonferroni (details in “Methods”). Hierarchical test used for transient amplitude. Two-way repeated measures ANOVA-Bonferroni for tau and time to peak. Total mice: 9 controls and 11 PKP2cKO. *p<0.05 vs. control, p<0.05 vs. LV. For panels G-K: Numbers of sparks/cells/mice in control dataset: 618 sparks from 46 LV cells; 594 sparks from 44 RV cells; 6 mice. Numbers of sparks/cells/mice in PKP2cKO dataset: 675 sparks from 58 LV cells; 1842 sparks from 63 RV cells; 7 mice. Statistical test: Hierarchical analysis. See “Methods” for details. **p<0.01 vs. control; ***p<0.001 vs. control; p<0.05 vs. LV; †††p<0.001 vs. LV.
Figure 2.
Figure 2.. Analysis of RyR2 clustering using single molecule-localization microscopy (SMLM).
A: Stochastic optical reconstruction microscopy (STORM)-acquired images of ryanodine receptor 2 (RyR2) in single myocytes dissociated from left ventricle (LV) or right ventricle (RV) of control (Ctrl) or plakophilin-2 conditional knockout (PKP2cKO) mice 14 days post-TAM. B: Yellow-boxed areas in A are shown in black and white for better visualization. Clusters within red circles in PKP2cKO are shown at larger magnification in the inset to illustrate the organization of small clusters in close proximity (scale bar in insets, 200 nm). C: Average size of RyR2 clusters in control and PKP2cKO myocytes. Control: n=24158 clusters from 11 LV cells; 14906 clusters from 8 RV cells. PKP2cKO: n=27365 clusters from 19 LV cells; 31852 clusters from 18 RV cells. D: Bar graph shows the proportion of super-clusters in control or PKP2cKO myocytes. LV control: 3280 super-clusters/23946 total clusters; LV PKP2cKO: 1581 super-clusters/7481 total clusters; RV control: 1435 super-clusters/14815 total clusters; RV PKP2cKO: 1534 super-clusters/9586 total clusters. Criteria used for defining super-clusters is diagrammed at the right of the panel. E: RyR2 molecular density, estimated as the number of RyR2 molecules (calculated by Density-Based Spatial Clustering of Applications with Noise; DBSCAN) per unit of cluster area (see also Methods). Number of clusters analyzed (including clusters with at least 10 RyRs):  32738 LV and 16595 RV clusters from control; 1666 LV and 4396 RV clusters from PKP2cKO. Statistical significance by two-way repeated measures analysis of variance (ANOVA)-Bonferroni test, ***p<0.001 vs. control. †††p<0.001 vs. LV.
Figure 3.
Figure 3.. [3H]Ryanodine binding in homogenates from control or PKP2cKO hearts.
A: [3H]Ryanodine binding as a function of free [Ca2+] in samples obtained from the left ventricle (LV) of either control (Ctrl) or plakophilin-2 conditional knockout (PKP2cKO) hearts 14 days post-TAM. B: Same as A but for samples obtained from the right ventricle (RV). Cumulative data for binding maximum (Bmax) is shown in C. Data normalized for the binding observed at 10 μM free [Ca2+] for LV and RV are shown in panels D and E, respectively. This correction allowed us to observe a shift in the concentration of free [Ca2+] that produces 50% of maximal [3H]Ryanodine binding (EC50) in the RV tissue of PKP2cKO hearts (F). n=4 hearts for each group. *p<0.05 vs. control. **p<0.01 vs. control. Two-way repeated measures analysis of variance (ANOVA)–Bonferroni test.
Figure 4.
Figure 4.. Mass spectrometry-based investigation of RyR2 phosphorylation state in LV versus RV of PKP2cKO hearts.
A: Summary of the eleven class-1 phosphopeptides identified. The first column indicates the position of the phosphorylated amino acid in the ryanodine receptor 2 (RyR2) sequence and the second column, the amino acid sequence of the peptide in which the phosphorylation site was measured. The numbers in brackets indicate the probability with which the localization of the phosphorylation site has been assigned to that particular residue (assignment of phosphorylation site localization depends on fragmentation pattern). B: Mass spectrometry-based intensity measurements of phosphopeptides covering the eleven phosphorylation sites. Intensities of all measured phosphopeptides are displayed. Measurements from right ventricle (RV) samples are depicted in green and measurements from left ventricle (LV) samples, in blue. The phosphorylation ‘hot spot’ of RyR2 is highlighted in red. Phosphorylation of site 2809 was exclusively identified in RV samples. C: Measured peptide covering T2809 is shown along with the detected fragment ions indicated. The fragment ions are highlighted in the tandem mass spectrometry (MS/MS) spectrum. The peptide contained one phosphate group, and due to the fragmentation pattern the phosphorylation site could be localized to threonine 2809. D: Data summary. Mass-spectrometry based intensity measurements of phosphopeptides covering the four phosphorylation sites in the “hotspot” region of RyR2 from tissue samples control (Ctrl) and plakophilin-2 conditional knockout (PKP2cKO) mice. Measurements from LV and RV samples depicted in light and dark green, respectively. n=3 for control samples and 4 for PKP2cKO samples.
Figure 5.
Figure 5.. Ca2+ content in the intracellular compartments.
A: Confocal line-scan images (1.43 ms/line) recorded from non-permeabilized myocytes isolated from the free walls of the left ventricle (LV) or the right ventricle (RV) of either control (Ctrl) or plakophilin-2 conditional knockout (PKP2cKO) mice 14 days post-tamoxifen (post-TAM). In this and other panels, the pulse of caffeine (10 mM) is indicated by the orange bar at the bottom of the image. Intracellular calcium changes were detected by a ratiometric method (FFluo-3/FFura Red; see also “Methods”). B: Time course and amplitude of the change in fluorescence during and immediately following the caffeine pulse. Notice the larger amplitude of the transient recorded from PKP2cKO RV myocytes. Cumulative data are shown in C. Number of experiments noted in the bar graphs. Cells originated from 5 different mice in each group (Ctrl or PKP2cKO). Statistical test: Two-way repeated measures analysis of variance (ANOVA)-Bonferroni. Control: n=29 LV cells, 23 RV cells. PKP2cKO: n=26 LV cells, 26 RV cells. **p<0.01 vs. control, ††p<0.01 vs. LV. D: Pseudo-colored confocal 2D images of the ratio of emission intensities (FFluo-3/FFura Red; see also “Methods”). The average of the calculated intensity ratios are shown in panel E. Statistical test: Hierarchical analysis. Control: n=50 LV cells, 50 RV cells from 5 mice. PKP2cKO n=50 LV cells, 50 RV cells from 5 mice. **p<0.01 vs. control ***p<0.001 vs. control, †††p<0.001 vs. LV. F: Confocal 2-D images of cardiomyocytes loaded with 2 μM Rhod 2-AM at low termperature (4°C) and then incubated at 37°C for 4 hours (see also “Methods”). For each group, two images from the same cell are shown: at rest (F0; left), and after one minute stimulation at 3 Hz (right). Notice the increased number of fluorescence emission units (mitochondria) after stimulation, particularly in the cell from the PKP2cKO RV. G: Average of the ratio of Rhod-2 fluorescence intensities acquired before (F0) and after (F) the period of pacing. Control (Ctrl): n=7 LV cells, 9 RV cells from 2 mice. PKP2cKO: n=9 LV cells, 10 RV cells from 2 mice. Statistical test: Two-way repeated measures ANOVA-Bonferroni. *p<0.05 vs. control, ††p<0.01 vs. LV.
Figure 6.
Figure 6.. Spark frequency at equal sarcoplasmic reticulum (SR) load and effect of PKC inhibition.
A-D: confocal line-scan images of Ca2+ sparks (green) in Control (Ctrl; A and C) or plakophilin-2 conditional knockout (PKP2cKO) samples (B and D) obtained from the left ventricle (LV; A and B) or the right ventricle (RV; C and D). Panel D shows sparks obtained when cells were maintained in either 1.8 mM [Ca2+]o (left) or in 0.6 mM [Ca2+]o (middle and right panels). In panels A-D, right-most panel corresponds to data obtained in the presence of protein kinase C (PKC) inhibitors bisindolylmaleimide I (GF 109203X; labelled GF; top) or Calphostin C (labelled Cal C; bottom). Panel E: Spark (spontaneous calcium release or SCR) events measured under the various conditions. + indicates in the presence of the PKC inhibitor (GF 109203X in top panel; Calphostin C in bottom panel). Blue bars: data obtained at 0.6 mM [Ca2+]o. All experiments were carried out in sequence on the same cell: recordings at [Ca2+]o 1.8 mM, then switched to 0.6 mM [Ca2+]o (for PKP2cKO RV) and then addition of PKC inhibitor. Each group was treated separately and only one variable (SCR frequency) was measured. cKO means plakophilin-2 conditional knockout. Paired sample t-test for Control LV, Ctrl RV, PKP2cKO–LV (same cell compared before and after treatment). One-way repeated measures analysis of variance (ANOVA)-Bonferroni for PKP2cKO-RV (same cell compared at [Ca2+]o 1.8 mM, then at 0.6 mM [Ca2+]o and then treatment). For experiments with GF 109203X: Control n=8 LV cells, 9 RV cells from 3 mice. PKP2cKO n=6 LV cells, 15 RV cells from 3 mice. **p<0.01. ***p<0.001 vs. 1.8 mM [Ca2+]o, p<0.05 vs. 0.6 mM [Ca2+]o For experiments with Calphostin C: Control n=9 LV cells, 7 RV cells from 3 mice. PKP2cKO n=11 LV cells, 13 RV cells from 3 mice. *p<0.05, ***p<0.001 vs. 1.8 mM [Ca2+]o, p<0.05 vs. 0.6 mM [Ca2+]o.
Figure 7.
Figure 7.. Membrane permeability to Lucifer Yellow and Cx43 expression.
A: Confocal images collected from the epicardial phase of either the free walls of the left ventricle (LV) or the right ventricle (RV) of hearts harvested from control (Ctrl), plakophilin-2 conditional knockout (PKP2cKO) mice 14 days post-tamoxifen (post-TAM) or a double knockout of PKP2 and Cx43, also at 14 days post-TAM (PKP2-Cx43-cKO). Images were obtained after a 30-min perfusion with 1 mg/mL Lucifer Yellow (LY; molecular weight 457; green), 1 mg/mL Rhodamine Dextran (molecular weight ~10,000) and 0.04 mg/mL Wheat Germ Agglutinin (WGA; red) in 10 nM free [Ca2+] solution (see “Methods” for further details). Image fields were chosen at random and the intensity of the LY fluorescence (in a scale 0–225) was measured within regions of interest (ROIs) that excluded areas void of cells. B: Average LY intensity measured from cells in the following groups: Control (Ctrl; black bars; n=512 LV cells, 774 RV cells from 3 mice), PKP2cKO (red bars; n=763 LV cells, 812 RV cells from 3 mice) and PKP2-Cx43-cKO (blue bars; n=617 LV cells, 729 RV cells from 2 mice). Statistical test: Two-way repeated measures analysis of variance (ANOVA)-Bonferroni ***p<0.001 vs. control; †††p<0.001 vs. LV; ###p<0.001 vs. PKP2cKO. C: Mean of the calculated values of [Ca2+]i after calibration of intensity ratios (see “Methods” for details). Control: n=34 LV cells, 32 RV cells from 4 mice. PKP2cKO n=29 LV cells, 28 RV cells from 4 mice. PKP2cKO/Cx43+/− refers to a PKP2cKO mice also heterozygous-null for Cx43 in cardiomyocytes (see also Methods). n=21 LV cells, 23 RV cells from 3 mice. Statistical test: Hierarchical analysis. *p<0.05 vs. control; #p<0.05 vs. PKP2cKO. D: Ca2+ spark frequency is significantly dampened by reduced Cx43 expression (green bar). Note that data for RV and LV Ctrl and PKP2cKO is reproduced from previous figures and presented here for comparison against PKP2cKO/Cx43+/−. Hierarchical analysis: PKP2cKOCx43+/−: n=18 LV cells, 21 RV cells from 3 mice. *p<0.05 vs. control; p<0.05 vs. LV; #p<0.05 vs. PKP2cKO.
Figure 8.
Figure 8.. Effect of the Cx43 hemichannel blocker TAT-Gap19 on intracellular calcium homeostasis in PKP2cKO mice.
The left side (panels “a”) of panels A-D reproduce data presented in previous figures, for comparison. Transactivator of transcription (TAT)-Gap19 (panels “b”) normalized the increased Ca2+ transient magnitude (relative transient amplitude), sarcoplasmic reticulum (SR) load and elevated diastolic Ca2+ and reduced the spark frequency toward values similar to those measured in myocytes of plakophilin-2 conditional knockout (PKP2cKO)-left ventricle (LV) and in controls. Statistical analysis in right panels: Two-way repeated measures analysis of variance (ANOVA)-Bonferroni for Ca2+ transients, SR load and diastolic Ca2+. Hierarchical analysis for Ca2+ spark frequency. *p<0.05 vs. control. p<0.05 vs. LV. 3 mice. Numbers in columns indicate number of cells tested.

References

    1. Chen SN, Gurha P, Lombardi R, Ruggiero A, Willerson JT and Marian AJ. The hippo pathway is activated and is a causal mechanism for adipogenesis in arrhythmogenic cardiomyopathy. Circ Res. 2014;114:454–468. - PMC - PubMed
    1. Bass-Zubek AE, Hobbs RP, Amargo EV, Garcia NJ, Hsieh SN, Chen X, Wahl JK 3rd, Denning MF and Green KJ. Plakophilin 2: a critical scaffold for PKC alpha that regulates intercellular junction assembly. J Cell Biol. 2008;181:605–613. - PMC - PubMed
    1. Cerrone M, Montnach J, Lin X, Zhao YT, Zhang M, Agullo-Pascual E, Leo-Macias A, Alvarado FJ, Dolgalev I, Karathanos TV, Malkani K, Van Opbergen CJM, van Bavel JJA, Yang HQ, Vasquez C, Tester D, Fowler S, Liang F, Rothenberg E, Heguy A, Morley GE, Coetzee WA, Trayanova NA, Ackerman MJ, van Veen TAB, Valdivia HH and Delmar M. Plakophilin-2 is required for transcription of genes that control calcium cycling and cardiac rhythm. Nature communications. 2017;8:106. - PMC - PubMed
    1. Dubash AD, Kam CY, Aguado BA, Patel DM, Delmar M, Shea LD and Green KJ. Plakophilin-2 loss promotes TGF-beta1/p38 MAPK-dependent fibrotic gene expression in cardiomyocytes. J Cell Biol. 2016;212:425–438. - PMC - PubMed
    1. Groeneweg JA, Bhonsale A, James CA, te Riele AS, Dooijes D, Tichnell C, Murray B, Wiesfeld AC, Sawant AC, Kassamali B, Atsma DE, Volders PG, de Groot NM, de Boer K, Zimmerman SL, Kamel IR, van der Heijden JF, Russell SD, Jan Cramer M, Tedford RJ, Doevendans PA, van Veen TA, Tandri H, Wilde AA, Judge DP, van Tintelen JP, Hauer RN and Calkins H. Clinical Presentation, Long-Term Follow-Up, and Outcomes of 1001 Arrhythmogenic Right Ventricular Dysplasia/Cardiomyopathy Patients and Family Members. Circulation Cardiovascular genetics. 2015;8:437–446. - PubMed

Publication types

LinkOut - more resources