

Right ventricular shape and function: cardiovascular magnetic resonance reference morphology and biventricular risk factor morphometrics in UK Biobank
- PMID: 31315625
- PMCID: PMC6637624
- DOI: 10.1186/s12968-019-0551-6
Right ventricular shape and function: cardiovascular magnetic resonance reference morphology and biventricular risk factor morphometrics in UK Biobank
Abstract
Background: The associations between cardiovascular disease (CVD) risk factors and the biventricular geometry of the right ventricle (RV) and left ventricle (LV) have been difficult to assess, due to subtle and complex shape changes. We sought to quantify reference RV morphology as well as biventricular variations associated with common cardiovascular risk factors.
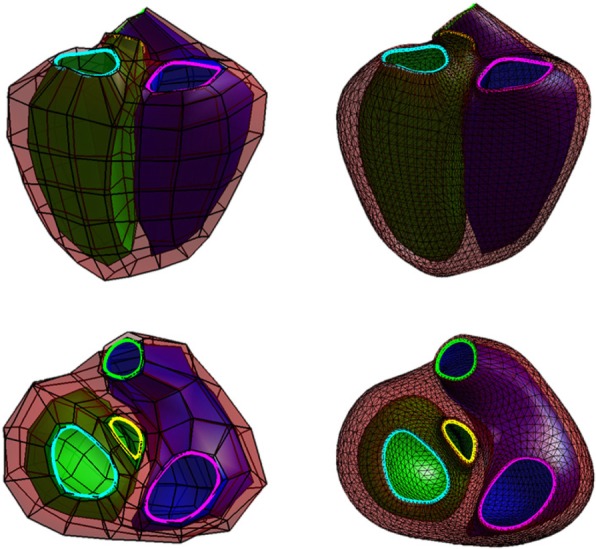
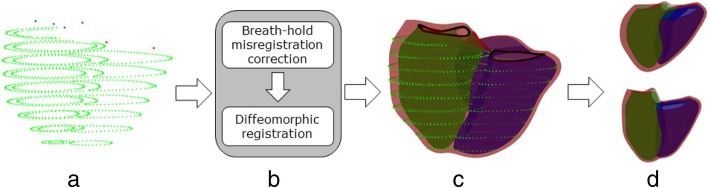
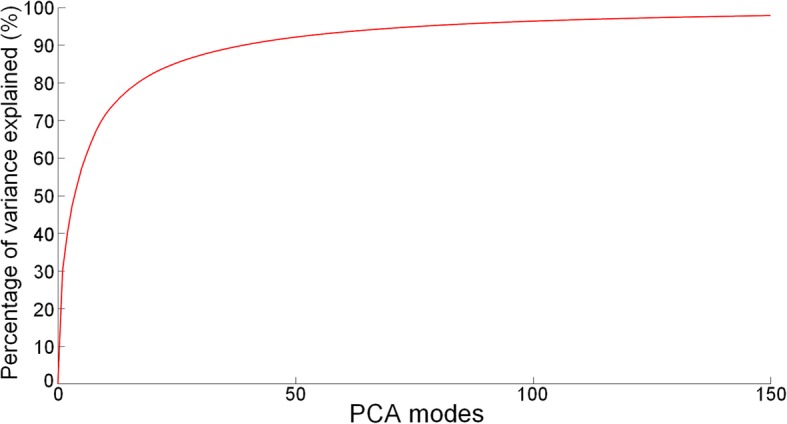
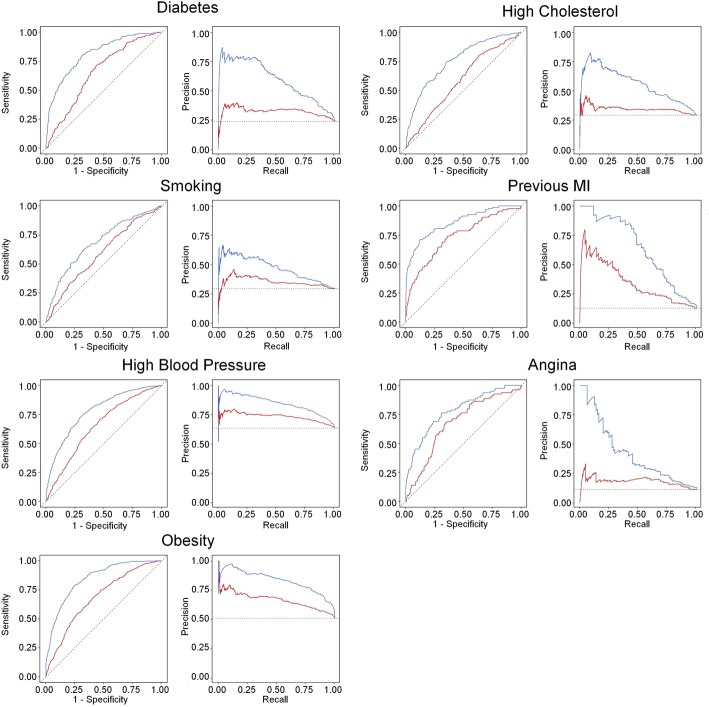
Methods: A biventricular shape atlas was automatically constructed using contours and landmarks from 4329 UK Biobank cardiovascular magnetic resonance (CMR) studies. A subdivision surface geometric mesh was customized to the contours using a diffeomorphic registration algorithm, with automatic correction of slice shifts due to differences in breath-hold position. A reference sub-cohort was identified consisting of 630 participants with no CVD risk factors. Morphometric scores were computed using linear regression to quantify shape variations associated with four risk factors (high cholesterol, high blood pressure, obesity and smoking) and three disease factors (diabetes, previous myocardial infarction and angina).
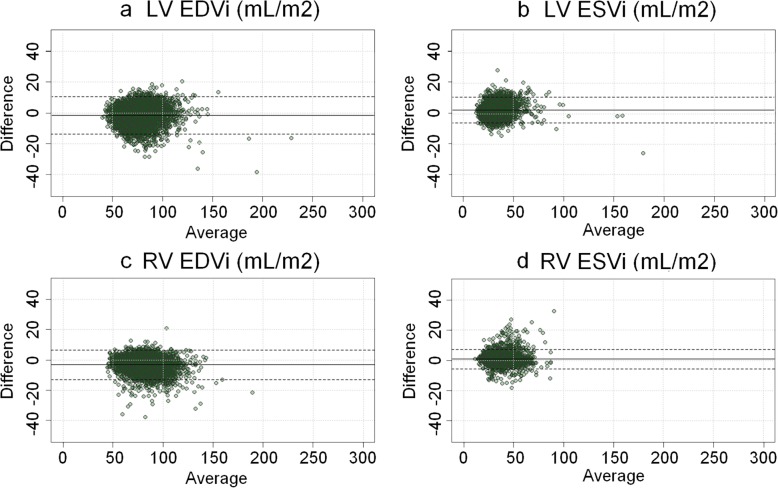
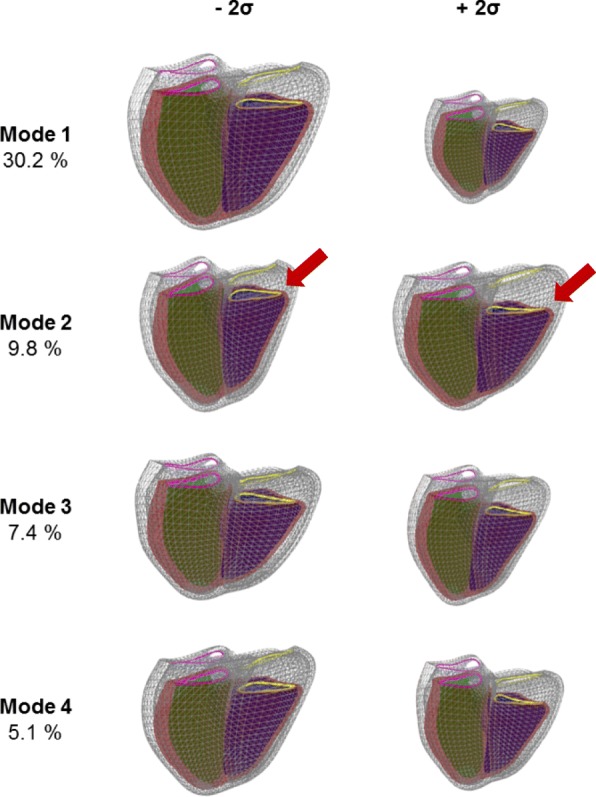
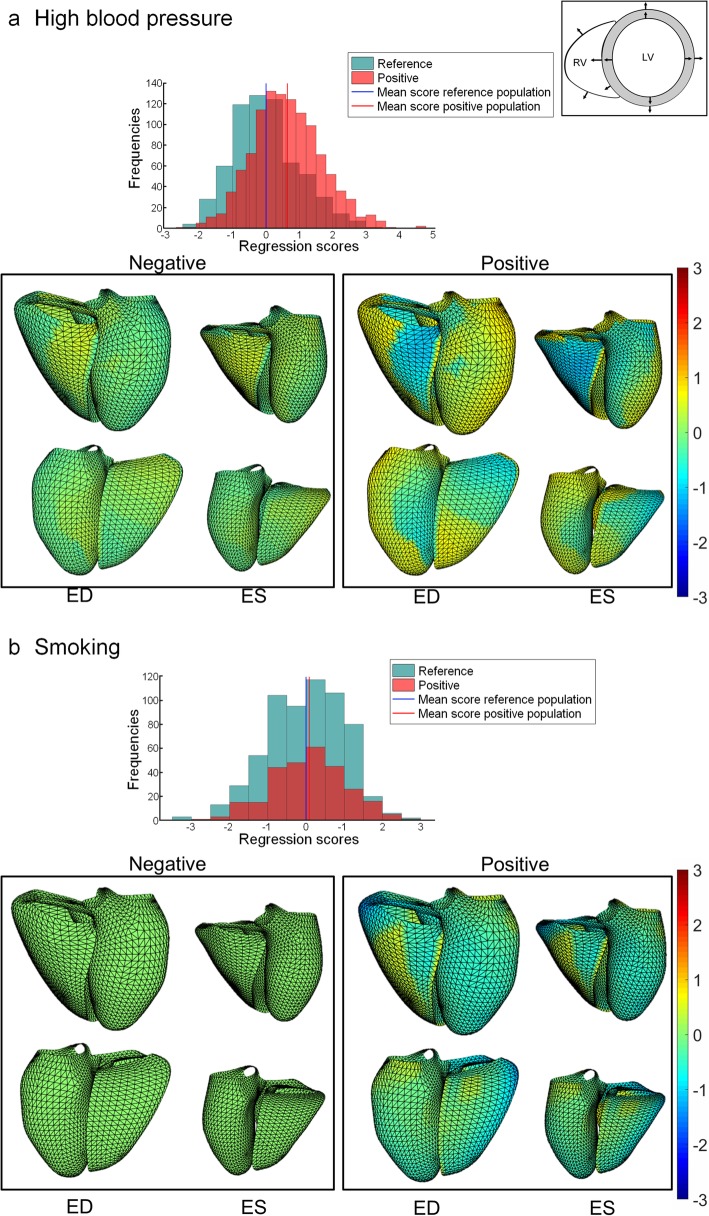
Results: The atlas construction led to an accurate representation of 3D shapes at end-diastole and end-systole, with acceptable fitting errors between surfaces and contours (average error less than 1.5 mm). Atlas shape features had stronger associations than traditional mass and volume measures for all factors (p < 0.005 for each). High blood pressure was associated with outward displacement of the LV free walls, but inward displacement of the RV free wall and thickening of the septum. Smoking was associated with a rounder RV with inward displacement of the RV free wall and increased relative wall thickness.
Conclusion: Morphometric relationships between biventricular shape and cardiovascular risk factors in a large cohort show complex interactions between RV and LV morphology. These can be quantified by z-scores, which can be used to study the morphological correlates of disease.
Keywords: Atlases; Cardiovascular magnetic resonance; UK biobank; Ventricular function.
Conflict of interest statement
The authors declare that they have no competing interests.
Figures
References
-
- Yusuf S, Hawken S, Ounpuu S, Dans T, Avezum A, Lanas F, McQueen M, Budaj A, Pais P, Varigos J, et al. Effect of potentially modifiable risk factors associated with myocardial infarction in 52 countries (the INTERHEART study): case-control study. Lancet. 2004;364:937–952. doi: 10.1016/S0140-6736(04)17018-9. - DOI - PubMed
-
- Chahal H, Johnson C, Tandri H, Jain A, Hundley WG, Barr RG, Kawut SM, Lima JA, Bluemke DA. Relation of cardiovascular risk factors to right ventricular structure and function as determined by magnetic resonance imaging (results from the multi-ethnic study of atherosclerosis) Am J Cardiol. 2010;106:110–116. doi: 10.1016/j.amjcard.2010.02.022. - DOI - PMC - PubMed
