Clinical Trial
. 2019 Jul 17;19(1):129.
doi: 10.1186/s12890-019-0889-4.

Application of structured statistical analyses to identify a biomarker predictive of enhanced tralokinumab efficacy in phase III clinical trials for severe, uncontrolled asthma

Affiliations
Clinical Trial

Application of structured statistical analyses to identify a biomarker predictive of enhanced tralokinumab efficacy in phase III clinical trials for severe, uncontrolled asthma

Mattis Gottlow et al. BMC Pulm Med. .

Abstract

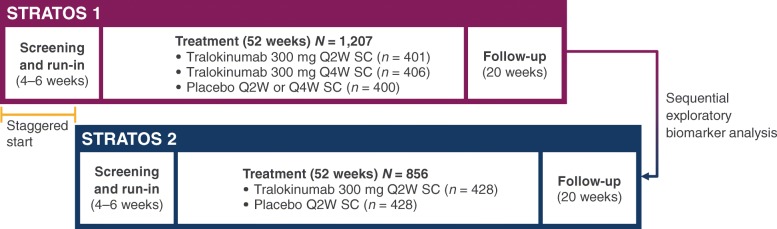
Background: Tralokinumab is an anti-interleukin (IL)-13 monoclonal antibody investigated for the treatment of severe, uncontrolled asthma in two Phase III clinical trials, STRATOS 1 and 2. The STRATOS 1 biomarker analysis plan was developed to identify biomarker(s) indicative of IL-13 activation likely to predict tralokinumab efficacy and define a population in which there was an enhanced treatment effect; this defined population was then tested in STRATOS 2.

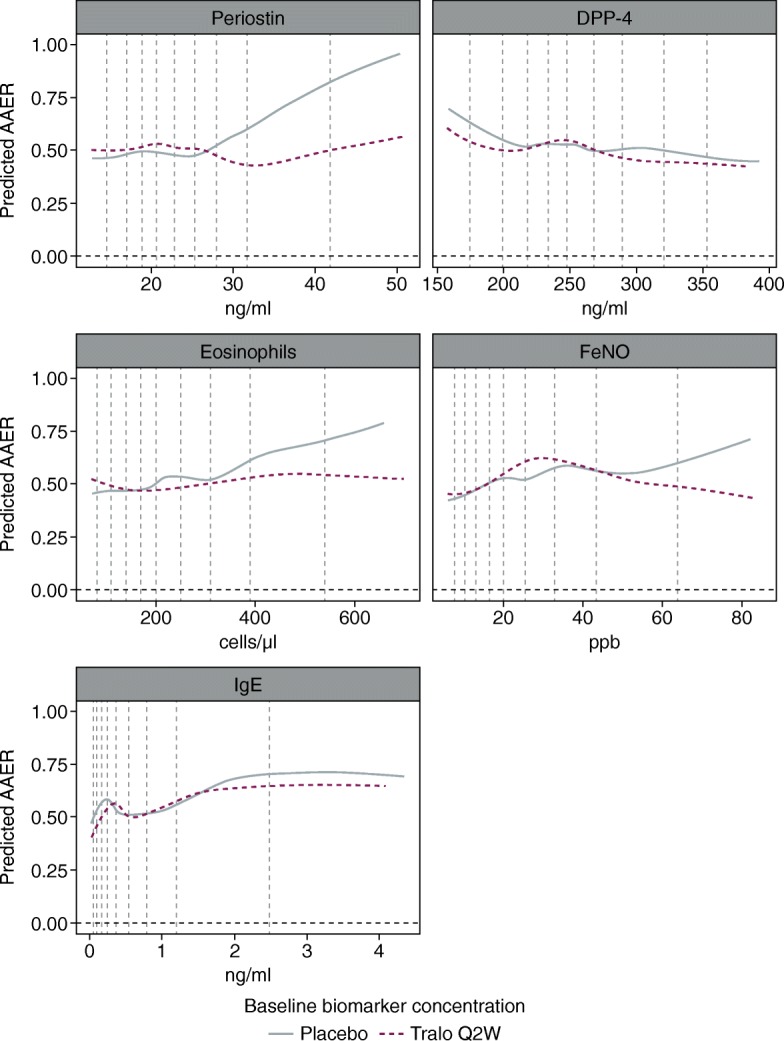
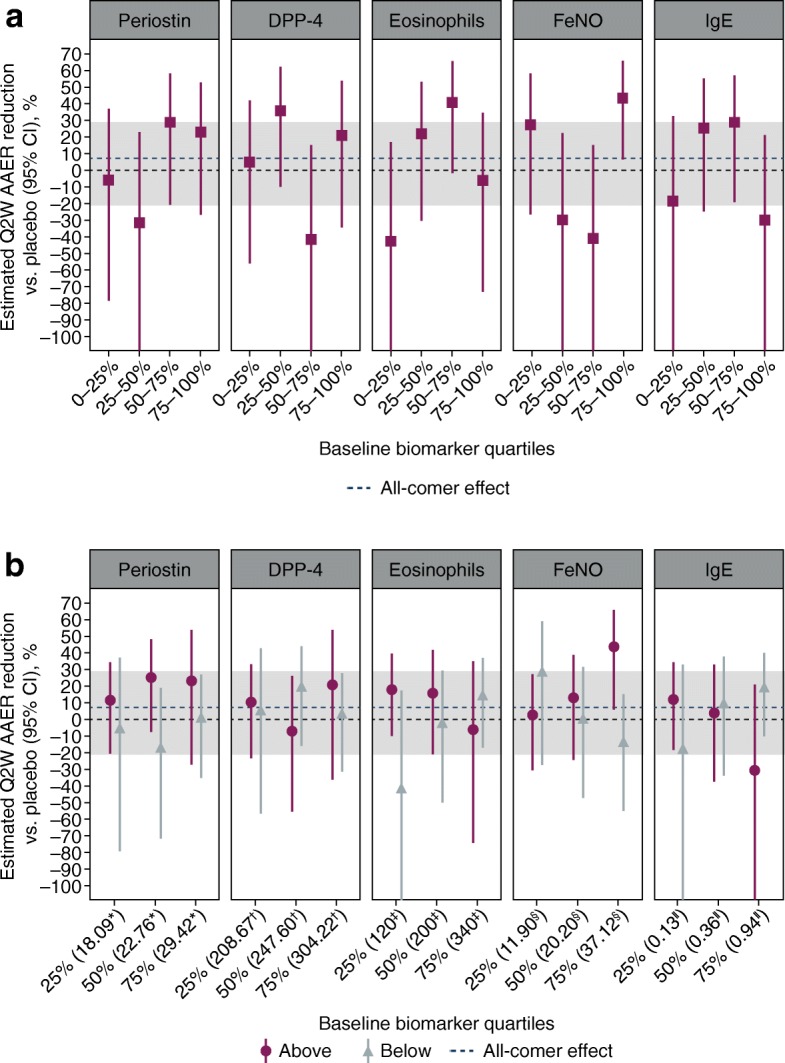
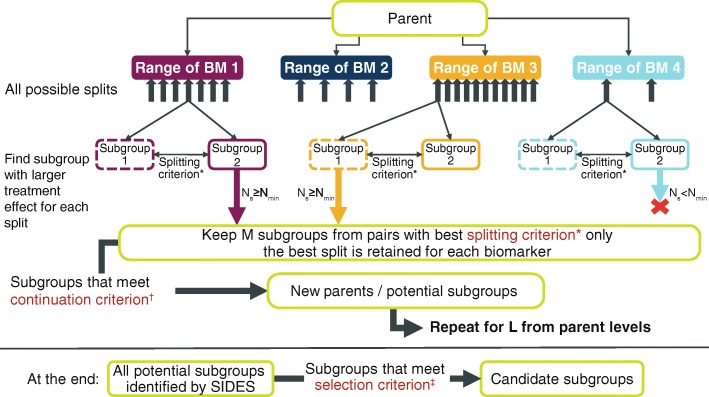
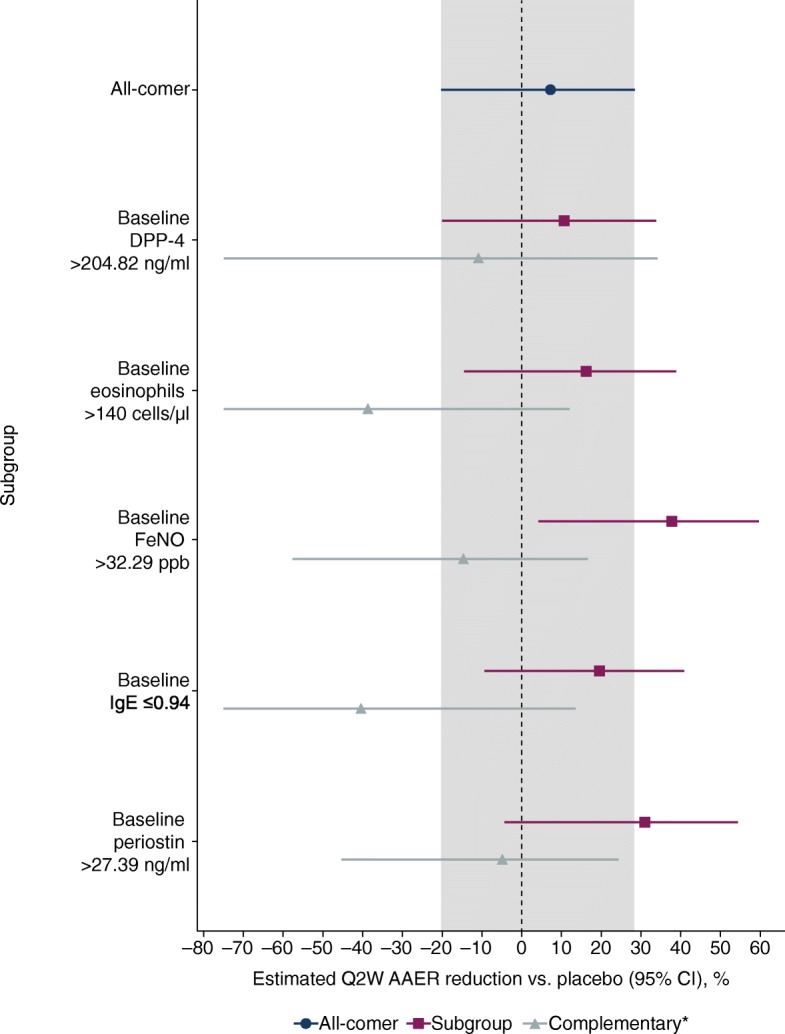
Methods: The biomarkers considered were blood eosinophil counts, fractional exhaled nitric oxide (FeNO), serum dipeptidyl peptidase-4, serum periostin and total serum immunoglobulin E. Tralokinumab efficacy was measured as the reduction in annualised asthma exacerbation rate (AAER) compared with placebo (primary endpoint measure of STRATOS 1 and 2). The biomarker analysis plan included negative binomial and generalised additive models, and the Subgroup Identification based on Differential Effect Search (SIDES) algorithm, supported by robustness and sensitivity checks. Effects on the key secondary endpoints of STRATOS 1 and 2, which included changes from baseline in standard measures of asthma outcomes, were also investigated. Prior to the STRATOS 1 read-out, numerous simulations of the methodology were performed with hypothetical data.

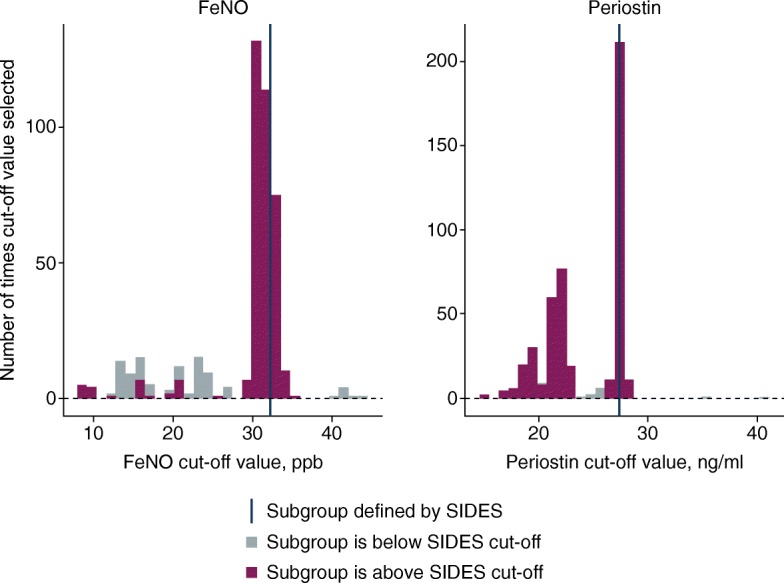
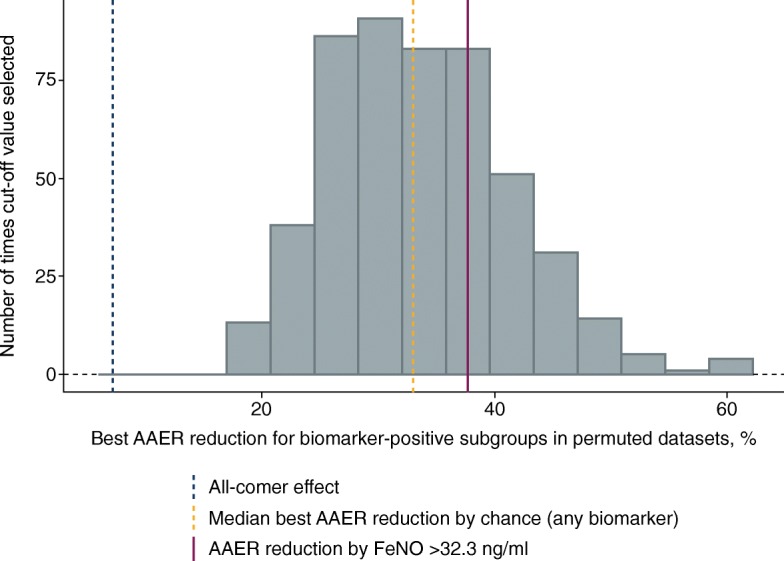
Results: FeNO and periostin were identified as the only biomarkers potentially predictive of treatment effect, with cut-offs chosen by the SIDES algorithm of > 32.3 ppb and > 27.4 ng/ml, respectively. The FeNO > 32.3 ppb subgroup was associated with greater AAER reductions and improvements in key secondary endpoints compared with the periostin > 27.4 ng/ml subgroup. Upon further evaluation of AAER reductions at different FeNO cut-offs, ≥37 ppb was chosen as the best cut-off for predicting tralokinumab efficacy.

Discussion: A rigorous statistical approach incorporating multiple methods was used to investigate the predictive properties of five potential biomarkers and to identify a participant subgroup that demonstrated an enhanced tralokinumab treatment effect. Using STRATOS 1 data, our analyses identified FeNO at a cut-off of ≥37 ppb as the best assessed biomarker for predicting enhanced treatment effect to be tested in STRATOS 2. Our findings were inconclusive, which reflects the complexity of subgroup identification in the severe asthma population.

Trial registration: STRATOS 1 and 2 are registered on ClinicalTrials.gov ( NCT02161757 registered on June 12, 2014, and NCT02194699 registered on July 18, 2014).

Keywords: Asthma; IL-13; Predictive biomarker; SIDES (subgroup identification based on differential effect search); STRATOS 1; STRATOS 2; Subgroup identification; Tralokinumab (up to 10).


Conflict of interest statement

MG, DJS, MH, KB, PW and GC are all employees of AstraZeneca, the sponsor of STRATOS 1 and STRATOS 2, and KB owns AstraZeneca shares. IL was an employee of IQVIA (formerly Quintiles) at the time of the study and provided consulting services per AstraZeneca’s contract with Quintiles; he is currently an employee of Eli Lilly.

Figures

Fig. 1
Fig. 1
Staggered trial design of STRATOS 1 and 2. Q2W, every 2 weeks; Q4W, every 4 weeks; SC, subcutaneous
Fig. 2
Fig. 2
Estimated relationships between biomarkers and annualised asthma exacerbation rate, predicted using negative binomial models in the STRATOS 1 all-comers population (full analysis set)*. *Estimates were based on negative binomial models including treatment group, geographical region, age, number of exacerbations in the previous year, biomarker and treatment*biomarker as covariates. The log of each participants’s corresponding follow-up time was used as an offset variable in the model to adjust for participants having different exposure times during which asthma exacerbations occurred. The two placebo groups were pooled before the analyses. Predictions for biomarker values between the 5 to 95% quantiles for each biomarker are shown, but all data are used in the estimation. Vertical dashed lines show the 10th to 90th percentiles. Two participants with outlier eosinophil values (7,510 and 4,130 cells/μl) were not included in the analyses. AAER, annual asthma exacerbation rate; DPP-4, dipeptidyl peptidase-4; FeNO, fractional exhaled nitric oxide; IgE, immunoglobulin E; Q2W, every 2 weeks; Tralo, tralokinumab
Fig. 3
Fig. 3
Estimated relationships between biomarkers and annualised asthma exacerbation rate, predicted using generalised additive models in the STRATOS 1 all-comers population (full analysis set)*. *Estimates were based on negative binomial models including treatment group, geographical region, age, number of exacerbations in the previous year and s(biomarker, by treatment) as covariates. Smoothing splines (s) are fitted by penalised likelihood using thin plate regression splines (mgcv R package). The log of each participants’s corresponding follow-up time was used as an offset variable in the model to adjust for participants having different exposure times during which asthma exacerbations occurred. Graphs show the exp.(LOESS[predicted GAM link function for each participant]), where 0.67 is the span used in the LOESS. Only data between the 5 to 95% quantiles for each biomarker are shown, but all data are used in the estimation. The two placebo groups were pooled before the models were estimated. Vertical dashed lines show the 10th to 90th percentiles. Two participants with outlier eosinophil values (7,510 and 4,130 cells/μl) were not included in the analyses. AAER, annual asthma exacerbation rate; DPP-4, dipeptidyl peptidase-4; FeNO, fractional exhaled nitric oxide; GAM, generalised additive models; IgE, Immunoglobulin E; LOESS, local polynomial regression; Q2W, every 2 weeks, Tralo, tralokinumab
Fig. 4
Fig. 4
Treatment effect with tralokinumab Q2W* within biomarker quartile groups (a), and in biomarker-high and -low subgroups defined by cumulative cut-offs (b) in the STRATOS 1 all-comers population (full analysis set). *Estimates within subgroups were based on negative binomial models including treatment group, geographical region, age, number of exacerbations in the previous year, biomarker group and treatment*biomarker group as covariates. The log of each participants’s corresponding follow-up time was used as an offset variable in the model to adjust for participants having different exposure times during which asthma exacerbations occurred. ‘Above’ and ‘below’ in panel B refer to participants with baseline biomarker concentrations falling above and below the indicated cut-off, respectively. The lower CI limits are truncated at − 110%. Two participants with outlier eosinophil values (7,510 and 4,130 cells/μl) were not included in the analyses. The two placebo groups were pooled before the analyses. ng/ml. Cells/μl. §ppb. AAER, annualised asthma exacerbation rate; CI, confidence interval; DPP-4, dipeptidyl peptidase-4; FeNO, fractional exhaled nitric oxide; IgE, immunoglobulin E; Q2W, every 2 weeks
Fig. 5
Fig. 5
Overview of the SIDES algorithm. *The splitting criterion is used to determine which child subgroups have improved efficacy and either comparable or improved safety compared with other child subgroups; for each biomarker, only the best split according to the splitting criterion is considered in the next step. There are four types of splitting criteria, one of which is applied to each SIDES run [24]: Criterion 1: maximising the differential effect between the two child subgroups. Criterion 2: maximising the treatment effect in at least one of the two child subgroups. Criterion 3: criterion 3 is a combination of criteria 1 and 2; it is used if criterion 1 is met (i.e. a difference is identified and the p-value is significant), but criterion 2 is not (the treatment effect in either subgroup is not significant). Criterion 4: maximising the differential effect between the two child subgroups in terms of both efficacy and safety. The continuation criterion aims to reduce the number of child subgroups tested by only pursuing those that demonstrate improvements compared with their parent [24]. The selection criterion is used to screen subgroups to identify only those in which the treatment effect reaches a threshold of clinical relevance [24]. BM, biomarker; L, maximum number of covariates defining a subgroup; M, maximum number of best candidate covariates to be considered at each step to define child subgroups; Ns, size of the subgroup with largest treatment effect based on the split; Nmin, minimum allowed subgroup size
Fig. 6
Fig. 6
SIDES subgroups and tralokinumab treatment effect in the STRATOS 1 all-comers population (full analysis set)*. *Estimates within subgroups were based on negative binomial models including treatment group, geographical region, age and number of exacerbations in the previous year. The log of each participants’s corresponding follow-up time was used as an offset variable in the model to adjust for participants having different exposure times during which asthma exacerbations occurred. The lower CI limits truncated at − 75%. Results are shown for the tralokinumab Q2W and pooled placebo arms based on a negative binomial model adjusted for baseline covariates. The placebo treatment group is a pooled treatment group (placebo Q2W + placebo Q4W). Complementary refers to the subgroup of participants not in the subgroup of interest, i.e. participants with baseline biomarker concentrations of: DPP-4 ≤ 204.8 ng/ml; eosinophils ≤140 cells/μl; FeNO ≤32.3 ppb; IgE > 0.9 ng/ml; periostin ≤27.4 ng/ml. AAER, annualised asthma exacerbation rate; CI, confidence interval; DPP-4, dipeptidyl peptidase-4; FeNO, fractional exhaled nitric oxide; IgE, immunoglobulin E; Q2W, every 2 weeks; SIDES, Subgroup Identification based on Differential Effect Search
Fig. 7
Fig. 7
Uncertainty in biomarker cut-offs in subgroups identified by SIDES in the STRATOS 1 all-comers population (full analysis set)*. *Number of bootstrap samples was 500. FeNO, fractional exhaled nitric oxide; SIDES, Subgroup Identification based on Differential Effect Search
Fig. 8
Fig. 8
Result of SIDES on permuted data in the STRATOS 1 all-comers population (full analysis set)*. *The plot provides an indication of how SIDES would perform on these data if there was no predictive biomarker. It is computed by permuting the five biomarkers, but removing all predictive (and prognostic) biomarker effects and re-running SIDES. Number of permutations was 500. AAER, annualised asthma exacerbation rate; FeNO, fractional exhaled nitric oxide; SIDES, Subgroup Identification based on Differential Effect Search

References

    1. Corren J. Role of interleukin-13 in asthma. Curr Allergy Asthma Rep. 2013;13:415–420. doi: 10.1007/s11882-013-0373-9. - DOI - PubMed
    1. Zhu Z, Homer RJ, Wang Z, Chen Q, Geba GP, Wang J, Zhang Y, Elias JA. Pulmonary expression of interleukin-13 causes inflammation, mucus hypersecretion, subepithelial fibrosis, physiologic abnormalities, and eotaxin production. J Clin Invest. 1999;103:779–788. doi: 10.1172/JCI5909. - DOI - PMC - PubMed
    1. Grunig G, Warnock M, Wakil AE, Venkayya R, Brombacher F, Rennick DM, Sheppard D, Mohrs M, Donaldson DD, Locksley RM, Corry DB. Requirement for IL-13 independently of IL-4 in experimental asthma. Science. 1998;282:2261–2263. doi: 10.1126/science.282.5397.2261. - DOI - PMC - PubMed
    1. Wills-Karp M, Luyimbazi J, Xu X, Schofield B, Neben TY, Karp CL, Donaldson DD. Interleukin-13: central mediator of allergic asthma. Science. 1998;282:2258–2261. doi: 10.1126/science.282.5397.2258. - DOI - PubMed
    1. Saha SK, Berry MA, Parker D, Siddiqui S, Morgan A, May R, Monk P, Bradding P, Wardlaw AJ, Pavord ID, Brightling CE. Increased sputum and bronchial biopsy IL-13 expression in severe asthma. J Allergy Clin Immunol. 2008;121:685–691. doi: 10.1016/j.jaci.2008.01.005. - DOI - PMC - PubMed

Publication types

MeSH terms

Associated data