Spending on World Health Organization essential medicines in Medicare Part D, 2011-15: retrospective cost analysis
- PMID: 31315833
- PMCID: PMC6635813
- DOI: 10.1136/bmj.l4257
Spending on World Health Organization essential medicines in Medicare Part D, 2011-15: retrospective cost analysis
Abstract
Objectives: To characterize the trends, drivers, and potential modifiers of increased spending by US Medicare beneficiaries on medicines deemed essential by the World Health Organization.
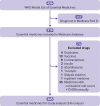
Design: Retrospective cost analysis of Medicare Part D Prescriber Public Use File, detailing annual generic and brand name drug prescribing and spending from 2011 through 2015 by Medicare Part D participants who filled prescriptions for WHO essential medicines.
Setting: US Medicare System.
Main outcome measures: Total and per beneficiary Medicare spending, total and per beneficiary out-of-pocket patient spending, cumulative beneficiary count, claim count, and per unit drug cost. All spending measures were adjusted for inflation and reported in 2015 US dollars.
Results: Medicare Part D expenditures on 265 WHO essential medicines between 2011 and 2015 was $87.2bn (£68.4bn; €76.5bn), with annual spending increasing from $11.9bn in 2011 to $25.8bn in 2015 (116%). Patients' out-of-pocket spending for essential medicines over the same period was $12.1bn. Total annual out-of-pocket spending increased from $2.0bn to $2.9bn (47%), and annual per beneficiary out-of-pocket spending on these drugs increased from $20.42 to $21.17 (4%). Total prescription count increased from 376.1m to 498.9m (33%), and cumulative beneficiary count grew from 95.9m to 135.8m (42%). Of the essential medicines included in the study, the per unit cost of 133 (50%) agents increased faster than the average inflation rate during this period. Overall, approximately 58% of the increase in total spending during this period can be attributed to the introduction of novel agents.
Conclusions: Spending associated with essential medicines grew substantially from 2011 to 2015, driven largely by the increased use of two expensive novel drugs used in treating hepatitis C. Approximately 22% of increased total spending during this period can be attributed to increases in per unit cost of existing drugs. These trends may limit patients' access to essential drugs while also increasing healthcare system costs.
Published by the BMJ Publishing Group Limited. For permission to use (where not already granted under a licence) please go to http://group.bmj.com/group/rights-licensing/permissions.
Conflict of interest statement
Competing interests: All authors have completed the ICMJE uniform disclosure form at www.icmje.org/coi_disclosure.pdf (available on request from the corresponding author) and declare: no support from any organization for the submitted work other than that described above; no financial relationships with any organizations that might have an interest in the submitted work in the previous three years; no other relationships or activities that could appear to have influenced the submitted work.
Figures


References
-
- The Economic Times. Prices of essential medicines cut by 30-50%. 2017. https://economictimes.indiatimes.com/industry/healthcare/biotech/pharmac....
Publication types
MeSH terms
Substances
Grants and funding
LinkOut - more resources
Full Text Sources
Medical
Molecular Biology Databases
