. 2019 Sep;68(9):1676-1687.
doi: 10.1136/gutjnl-2018-317811. Epub 2019 Jul 17.

Expression of the type 3 InsP3 receptor is a final common event in the development of hepatocellular carcinoma

Affiliations

Expression of the type 3 InsP3 receptor is a final common event in the development of hepatocellular carcinoma

Mateus T Guerra et al. Gut. 2019 Sep.

Erratum in

Abstract

Background & objectives: Hepatocellular carcinoma (HCC) is the second leading cause of cancer death worldwide. Several types of chronic liver disease predispose to HCC, and several different signalling pathways have been implicated in its pathogenesis, but no common molecular event has been identified. Ca2+ signalling regulates the proliferation of both normal hepatocytes and liver cancer cells, so we investigated the role of intracellular Ca2+ release channels in HCC.

Design: Expression analyses of the type 3 isoform of the inositol 1, 4, 5-trisphosphate receptor (ITPR3) in human liver samples, liver cancer cells and mouse liver were combined with an evaluation of DNA methylation profiles of ITPR3 promoter in HCC and characterisation of the effects of ITPR3 expression on cellular proliferation and apoptosis. The effects of de novo ITPR3 expression on hepatocyte calcium signalling and liver growth were evaluated in mice.

Results: ITPR3 was absent or expressed in low amounts in hepatocytes from normal liver, but was expressed in HCC specimens from three independent patient cohorts, regardless of the underlying cause of chronic liver disease, and its increased expression level was associated with poorer survival. The ITPR3 gene was heavily methylated in control liver specimens but was demethylated at multiple sites in specimens of patient with HCC. Administration of a demethylating agent in a mouse model resulted in ITPR3 expression in discrete areas of the liver, and Ca2+ signalling was enhanced in these regions. In addition, cell proliferation and liver regeneration were enhanced in the mouse model, and deletion of ITPR3 from human HCC cells enhanced apoptosis.

Conclusions: These results provide evidence that de novo expression of ITPR3 typically occurs in HCC and may play a role in its pathogenesis.

Keywords: apoptosis; calcium signaling; cell growth; liver cancer; methylation.


Conflict of interest statement

Competing interests: None declared.

Figures

Figure 1
Figure 1. ITPR3 is expressed in human HCC and is associated with poorer survival.
(A) ITPR3 expression in a histologically normal liver biopsy (top left) and an HCC specimen (top middle). Bottom row showing a magnified view of the regions marked with the black square in the top row. Bottom left: showing ITPR3 expressed in the apical region of a bile duct in the normal liver specimen (arrow) but is minimal in surrounding hepatocytes. Bottom middle: showing that there is diffuse cytosolic staining of ITPR3 in HCC hepatocytes. Top and bottom right showing a negative control (scale bar, 20 μm). (B) Quantification of ITPR3 staining showing that labelling is significantly increased in HCC specimens from patients with NASH and HCV (p<0.05, n=15 and p<0.01, n=6; respectively by ANOVA with Dunnett’s post-test) relative to control specimens (n=17). The remaining samples were: alcoholic liver disease (n=5) and HBV infection (n=2); additionally, two specimens were from patients in which two of these liver diseases were present. (C) ITPR3 staining in HCC (tumour) and (NAT) in a representative image from a commercially obtained tissue microarray (scale bar, 200 μm). (D) ITPR3 staining of HCC was significantly increased relative to the correspondent NATs. (n=40, p<0.01 by paired t test). (E) Five-year survival is reduced in patients with HCC with ITPR3 mRNA expression with z >1 above the mean (median=37.3 months, n=39) in comparison to all other patients with HCC (median= 60.8 months, n=332; p<0.01 by Log-rank test). (F) Disease-free survival is also decreased in patients with HCC higher ITPR3 expression (median=10.4 months in high ITPR3 versus median=23.0 months in other patients with HCC; p<0.004 by Log-rank test). (G) mRNA expression of ITPR1–3 in control (n=26) and patients with HCC (n=89). ITPR1 and ITPR2, which are physiologically expressed in hepatocytes, are not altered in HCC, but ITPR3 expression is significantly increased in HCC (p<0.05, Bonferroni post-tests). (H) mRNA expression of ITPR3 correlates with the clinical stage of HCC. mRNA levels of ITPR1 and ITPR2 are similar in clinical stages I-III. However, mRNA of ITPR3 is significantly increased in stage II and stage III compared with control (**p<0.05 and ***p<0.001, Bonferroni post-tests, respectively). (I) Representative images of ITPR3 staining in specimens collected from Universidade Federal de Minas Gerais diagnosed with GSD (n=10), and different stages of the of HCV infection, such as fibrosis (n=20), cirrhosis (n=20) and tumour (n=20). ITPR3 was not detected in GSD hepatocytes, even though it was expressed in cholangiocytes (inset) (scale bar, 50 μm). (J) Quantification of ITPR3 staining according to the degree of fibrosis showing that ITPR3 starts to be expressed as early as in moderate fibrosis and remains elevated until the tumour stage in specimens from HCV-infected patients (**p<0.05, ***p<0.01 and ****p<0.001). (K) ITPR3 expression is not correlated to inflammatory activity in HCV infection specimens. ALD, alcoholic liver disease; ANOVA, analysis of variance; GSD, glyocogen storage disease; HBV, hepatitis B virus; HCC, hepatocellular carcinoma; HCV, hepatitis C virus; IPTR1, type 1 isoform of the inositol 1, 4, 5-trisphosphate receptor; IPTR2, type 2 isoform of the inositol 1, 4, 5-trisphosphate receptor; IPTR3, type 3 isoform of the inositol 1, 4, 5-trisphosphate receptor; NASH, non-alcoholic steatohepatitis; NAT, non-tumour adjacent tissue.
Figure 2
Figure 2. The promoter of human ITPR3 is demethylated in HCC.
(A) CpG islands in the promoter region of the human ITPR3 gene. The lower line indicates 0% likelihood of a CpG island and the upper line indicates 100% likelihood. (B) Schematic representation of 16 methylated regions in the ITPR3 promoter, analysed by bioinformatics using GEO data for control patients and TCGA data for patients with HCC. (C) Methylation of the ITPR3 promoter from patients with HCC (n=40) is lower than in control patients (n=23) at 16 different sites (*p<0.05, Bonferroni post-tests). (D) Percentage methylation of the promoter region of the human ITPR1, ITPR2 and ITPR3 genes. HCC values are relative to that observed in controls. GEO, Gene Expression Omnibus; HCC, hepatocellular cancer; TCGA, The Cancer Genome Atlas.
Figure 3
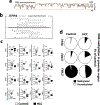
Figure 3. DNA methylation levels are decreased in HCC and in mice treated with 5’-aza
(A) Experimental protocol of 5’-aza treatment in mice. (B) Immunoblot of hepatocyte lysates demonstrating reduction of total methylated cytosine (5mC) after treatment with 5’-aza. (C) Densitometric analysis showing ~50% reduction in methylation after 5’-aza treatment (n=3, *p<0.05, Bonferroni post-test). (D) Demethylation sites of CpG islands in the mouse ITPR3 promoter region after 5’-aza treatment. Black dots represent methylated sites and white dots represent demethylated sites (n=3 animals for each condition). (E) Percentage of methylated CpG (mCpG, black) and demethylated CpG (white) in the promoter region of the mouse ITPR3 gene. (F) Representative images of immunostaining for 5mC in livers from patients with GSD (n=10), and different stages of HCV infection, including fibrosis (n=20), cirrhosis (n=20) and tumour (n=20) (scale bar, 50 μm). (G) Quantification of nuclear 5mC staining showing that methylation is markedly decreased in HCV-related cirrhosis and tumour compared with GSD and HCV-related fibrosis (***p<0.01 and #p<0.001, Bonferroni posttests). 5’-aza, 5’-azacitine; GSD, glycogen storage disease; HCC, hepatocellular carcinoma; HCV, hepatitis C virus; ITPR3, type 3 isoform of the inositol 1, 4, 5-trisphosphate receptor.
Figure 4
Figure 4. Demethylation induces ITPR3 expression in hepatocytes in vivo.
(A) ITPR3 mRNA expression in isolated hepatocytes is significantly increased after 5’-aza treatment, relative to controls (n=5 in each group, *p<0.05, Bonferroni post-tests). (B) ITPR3 staining (green) in isolated mouse hepatocytes from control liver and after 5’-aza treatment demonstrating the subcellular pattern of ITPR3 expression. Nuclei are shown in blue (scale bar, 10 μm). (C) Immunoblot of liver lysates showing the presence of ITPR3 in the nuclei of hepatocytes after the demethylation treatment. (D) Densitometric analysis showing cytosolic and nuclear expression of ITPR3 in hepatocytes in 5’-aza-treated hepatocyte lysate (*p<0.05 and **p<0.01, Bonferroni post-tests). (E) Immunohistochemistry for ITPR3 in liver sections showing that expression after 5’-aza treatment is mostly concentrated in the region of the central venule (scale bar, 100 μm). (F) Representative immunoblot of hepatocyte lysates demonstrating that 5’-aza treatment increases ITPR3 expression relative to control. ITPR1 and ITPR2 expressions are unchanged by 5’-aza. (G) Densitometric analyses showing that ITPR3 is the only ITPR isoform with increased expression after 5’-aza treatment (n=3, **p<0.01, by Student t-test). 5’-aza, 5’-azacitine; ITPR1, type 1 isoform of the inositol 1, 4, 5-trisphosphate receptor; ITPR2, type 2 isoform of the inositol 1, 4, 5-trisphosphate receptor; ITPR3, type 3 isoform of the inositol 1, 4, 5-trisphosphate receptor; NSB, non-specific binding control.
Figure 5
Figure 5. Demethylation enhances calcium signalling in hepatocytes in vivo.
(A) Representative time course of hepatocyte Ca2+ signals following stimulation by intravenous infusion of AVP (100 ng/mL), monitored by in vivo time-lapse confocal imaging of livers in animals treated with 5’-aza and controls. Fluorescence of the Ca2+ dye Fluo-4 is expressed as a percentage of basal fluorescence. (B) Peak fluorescence after AVP stimulation is more than doubled in animals treated with 5’-aza (n=3 animals per group, ***p<0.001). (C) Representative pseudocolored confocal fluorescence image showing identification of PC and PP regions. (D) Representative time course of Fluo-4 fluorescence levels in hepatocytes near the central venule (PC region), where ITPR3 expression is increased by 5’-aza. Note the increase is greater than is seen by imaging the whole liver. (E) Representative time course of Fluo-4 fluorescence levels in hepatocytes near the portal venule (PP region), where little to no ITPR3 expression is induced by 5’-aza. Note the increase is smaller than that observed in the whole liver. (F) Fluorescence peak after AVP stimulation is higher in PC hepatocytes from animals treated with 5’-aza (***p<0.001) than in PP hepatocytes from the same group (**p<0.01). (G) Time to maximal peak of Ca2+ in PC hepatocytes is higher in PC hepatocytes from 5’-aza treated animals (***p<0.01). (H) Fluorescence peaks in PC and PP hepatocyte nuclei are significantly increased in animals treated with 5’-aza compared with controls. Fluorescence is expressed as a percentage of basal fluorescence. (n=20 nuclei were monitored per animal in 3 animals per group, ***p<0.001). AVP, arginine vasopressin; 5’-aza, 5’-azacitidine; ITPR3, type 3 isoform of the inositol 1, 4, 5-trisphosphate receptor; PC, pericentral; PP, periportal.
Figure 6
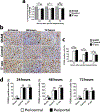
Figure 6. Demethylation accelerates liver regeneration in mice.
(A) Liver-to-body weight ratio at 24, 48 and 72 hours after PH showing increased ratio in 5’-aza-treated group, relative to controls (n=5 animals per group, *p<0.05; ** p<0.01; ***p<0.001, Bonferroni post-test). (B) Immunohistochemistry for PCNA in liver sections after PH (scale bar, 100 μm). (C) Quantification of PCNA positive cells 24, 48 and 72 hours after PH, demonstrating that 5’-aza treatment increases hepatocyte proliferation (n=5 animals per group, **p<0.01; ***p<0.001). (D) Quantification of PCNA positive cells in PC and PP regions 24, 48 and 72 hours after PH. Dotted regions on the micrograph illustrate pericentral and periportal areas used for quantification as defined in the methods section. 5’-aza, 5’-azacitidine; PC, pericentral; PH; partial hepatectomy; PP, periportal.
Figure 7
Figure 7. Knockout of ITPR3 sensitises liver cancer cells to apoptosis
(A) Representative western blot showing efficient elimination of ITPR3 expression in HepG2 cells by CRISPR-Cas9 in two separate clones. Expression of RFP as a marker for successful integration of the knockout cassette in the genome of HepG2 cells (scale bar, 20μm). (B) Caspase 3/7 activity after treatment of HepG2 cells with STA is increased in ITPR3KO relative to WT cells (values are mean±SEM, n=9 in each group, *p<0.01). (C) Similarly, the percentage of Annexin 5-positive cells is increased in ITPR3KO cells when compared with WT cells on overnight treatment with STA (values are mean±SEM, n=4 in each group; *p<0.01). (D) ITPR3KO cells have increased Caspase3/7 activity when treated with Etoposide (values are mean±SEM, n=3 in each group; p<0.001). (E) Super-resolution image of a representative HepG2 cell coexpressing EGFP-ITPR3 and mKO2-TOMM20 (mitochondrial marker). Top row: scale bar, 5 μm. Bottom row: scale bar, 1 μm. (F) Representative immunoblot for cleaved caspase 3 in hepatocyte lysates from control and 5’-aza-treated mice after STA treatment. (G) Densitometric analysis showing that 5’-aza treatment prevents the increase of cleaved caspase 3 in hepatocytes (***p<0.01). (H) Percentage of YOPRO-1-positive cells in HepG2 WT after STA treatment. The over expression of ITPR3 in HepG2 cells prevents apoptosis induced by STA. (I) Volcano plot showing the expression of apoptotic genes in HepG2 WT cells compared with HepG2 ITPR3KO cells. Genes to the left of zero are downregulated and the ones to the right of zero are upregulated in WT versus ITPR3KO. The genes represented by open symbols, SIAH2 and POU4F1, showed the highest adjusted p-value. Grey symbols show genes with adjusted p-value >1.0. Black symbols represent the remaining genes. 5’-aza, 5’-azacitine; DMSO, dimethyl sulfoxyde; GAPDH, glyceraldehyde 3-phosphate dehydrogenase; ITPR3, type 3 isoform of the inositol 1, 4, 5-trisphosphate receptor; KO, knockout; RFP, red fluorescent protein; RLU, relative light units; STA, staurosporine; WT, wild type.

References

    1. El-Serag HB, Kanwal F. Epidemiology of hepatocellular carcinoma in the United States: where are we? Where do we go? Hepatology 2014;60:1767–75. - PMC - PubMed
    1. Heimbach J, Kulik LM, Finn R, Sirlin CB, Abecassis M, Roberts LR, et al. Aasld guidelines for the treatment of hepatocellular carcinoma. Hepatology 2017. - PubMed
    1. Llovet JM, Zucman-Rossi J, Pikarsky E, Sangro B, Schwartz M, Sherman M, et al. Hepatocellular carcinoma. Nat Rev Dis Primers 2016;2:16018. - PubMed
    1. Rodrigues MA, Gomes DA, Leite MF, Grant W, Zhang L, Lam W, et al. Nucleoplasmic calcium is required for cell proliferation. J Biol Chem 2007;282:17061–8. - PMC - PubMed
    1. Gomes DA, Rodrigues MA, Leite MF, Gomez MV, Varnai P, Balla T, et al. c-Met must translocate to the nucleus to initiate calcium signals. J Biol Chem 2008;283:4344–51. - PMC - PubMed

Publication types

MeSH terms

Substances