. 2019 Aug 5;218(8):2762-2781.
doi: 10.1083/jcb.201809121. Epub 2019 Jul 17.

Yorkie controls tube length and apical barrier integrity during airway development

Affiliations

Yorkie controls tube length and apical barrier integrity during airway development

Kassiani Skouloudaki et al. J Cell Biol. .

Erratum in

Abstract

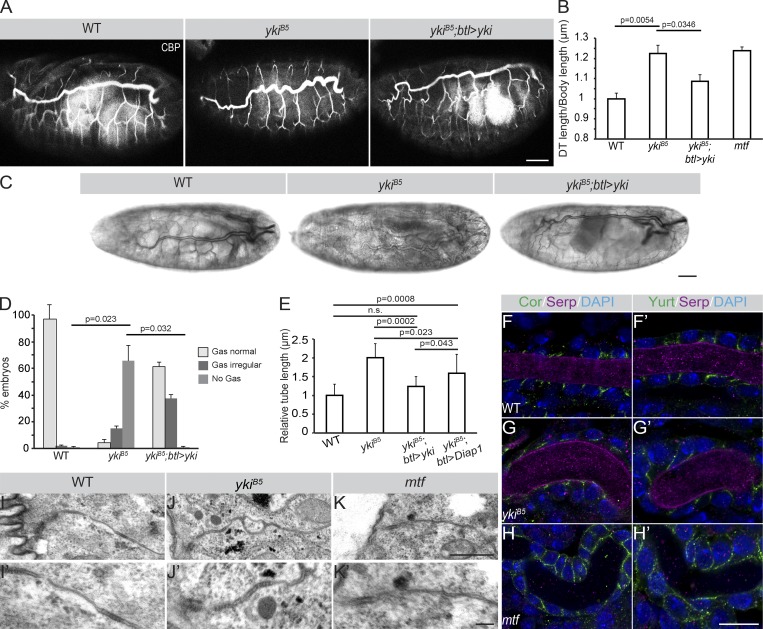
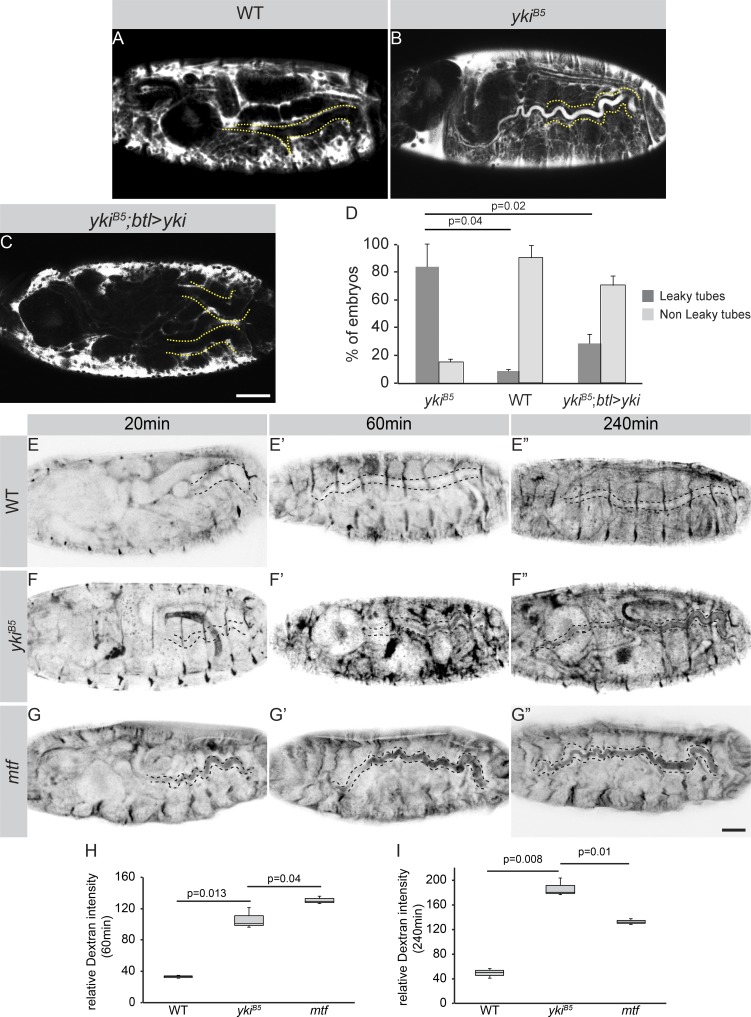
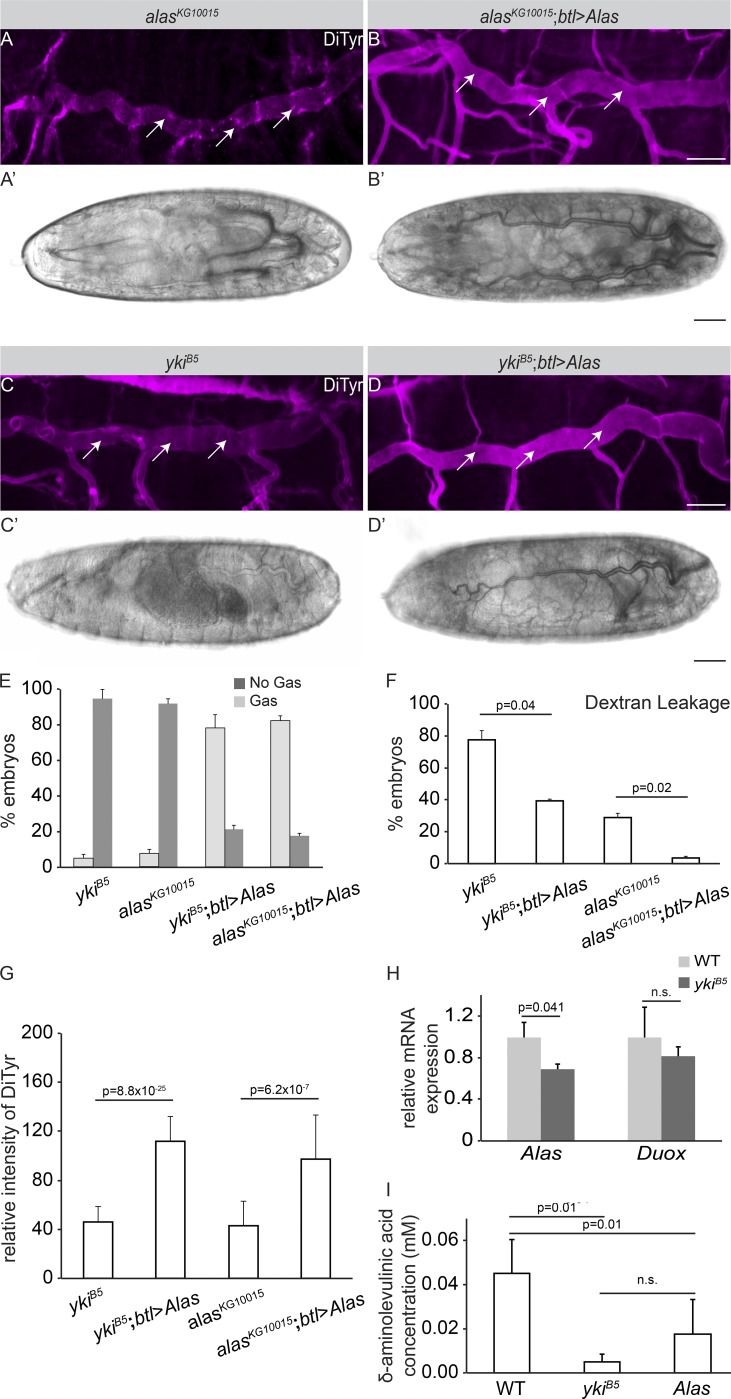
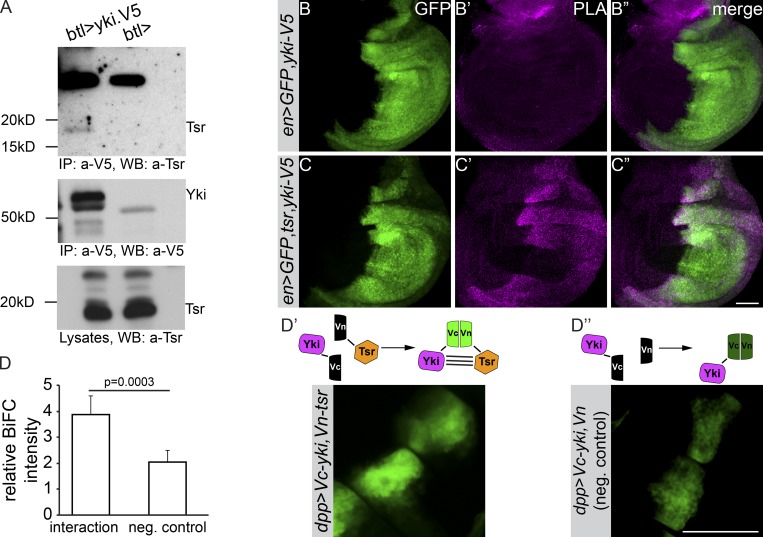
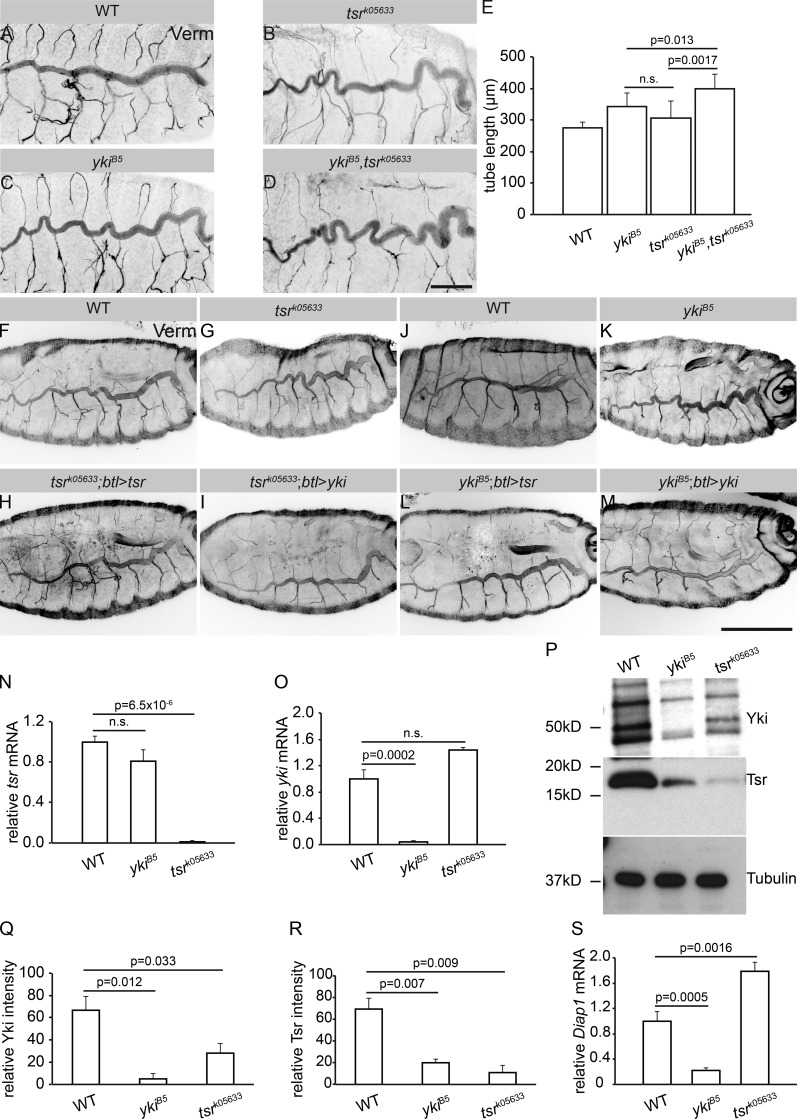
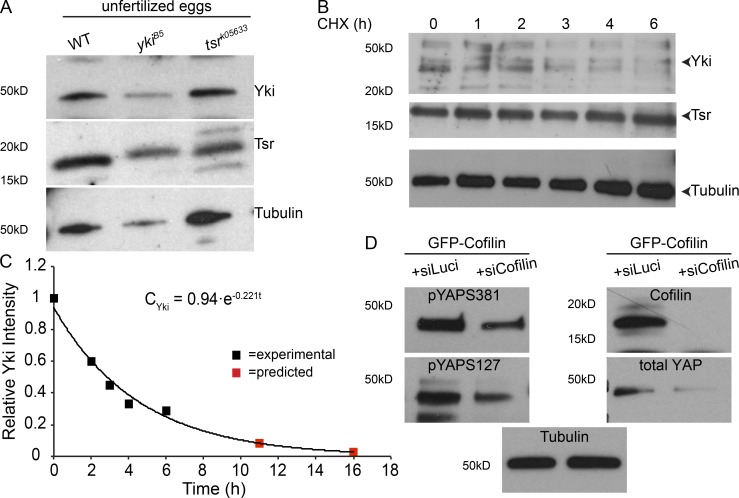
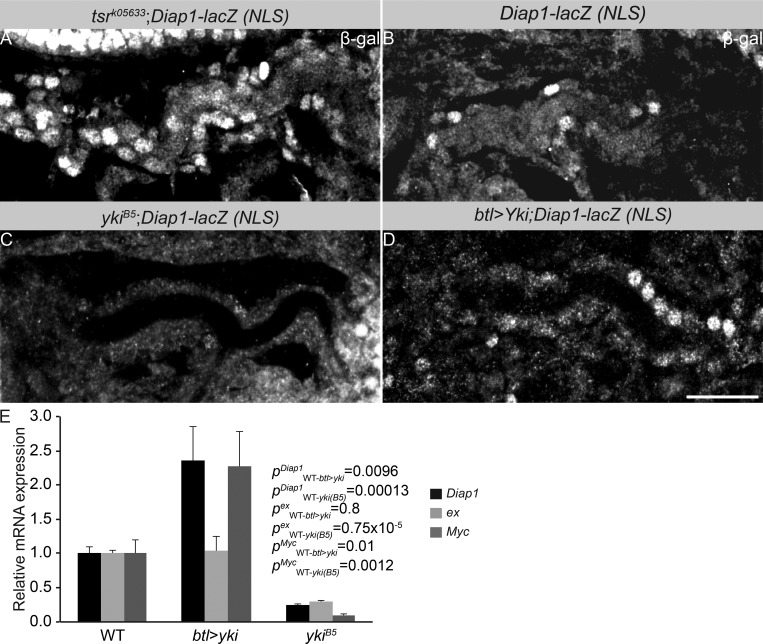
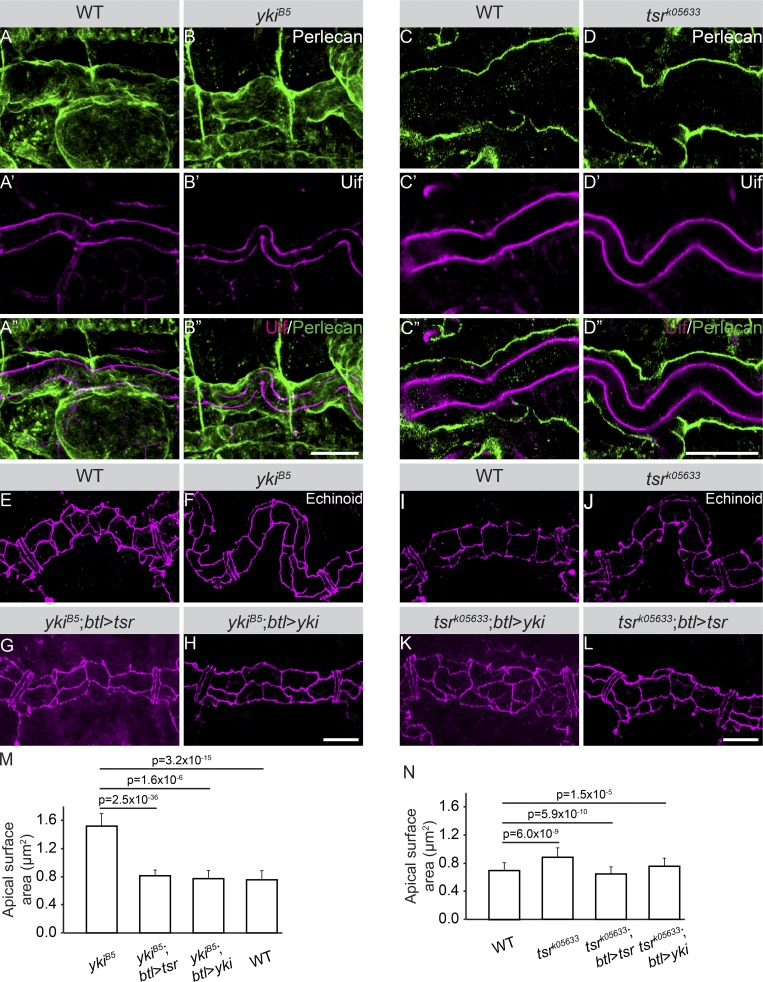
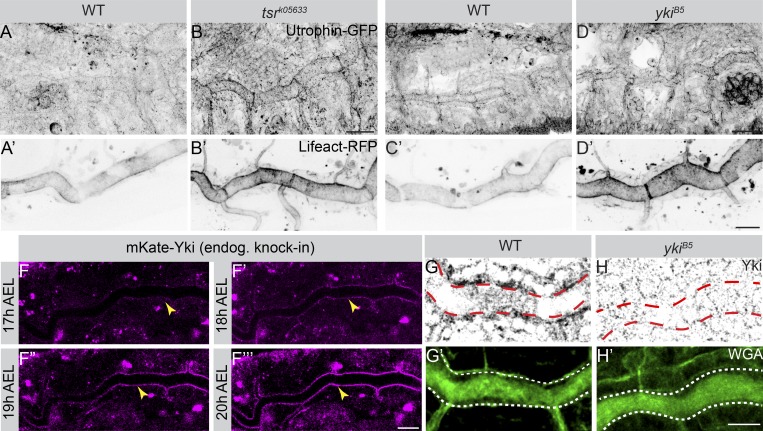
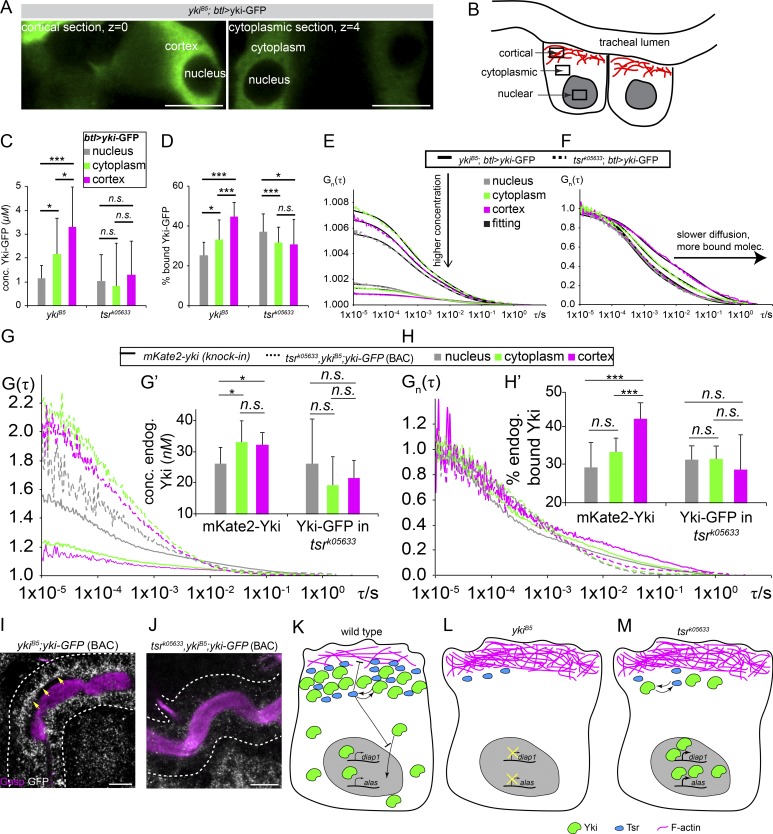
Epithelial organ size and shape depend on cell shape changes, cell-matrix communication, and apical membrane growth. The Drosophila melanogaster embryonic tracheal network is an excellent model to study these processes. Here, we show that the transcriptional coactivator of the Hippo pathway, Yorkie (YAP/TAZ in vertebrates), plays distinct roles in the developing Drosophila airways. Yorkie exerts a cytoplasmic function by binding Drosophila Twinstar, the orthologue of the vertebrate actin-severing protein Cofilin, to regulate F-actin levels and apical cell membrane size, which are required for proper tracheal tube elongation. Second, Yorkie controls water tightness of tracheal tubes by transcriptional regulation of the δ-aminolevulinate synthase gene (Alas). We conclude that Yorkie has a dual role in tracheal development to ensure proper tracheal growth and functionality.


Figures

Figure 1.
Figure 1.
Yki is required to restrict tracheal tube length without affecting SJs and luminal matrix. (A) WT, ykiB5, and ykiB5;btl>yki late stage 16 embryos, stained with the chitin-binding probe (CBP). Note the convoluted DT tubes in ykiB5 mutant embryos. Tracheae-specific expression of yki rescues this phenotype. Scale bar: 50 µm. (B) DT length is significantly increased in ykiB5 mutants (n = 20) compared with that of WT (n = 9) embryos or ykiB5 mutant embryos expressing yki under the control of the tracheal driver btl-Gal4, ykiB5;btl>yki (n = 15). Tube length is expressed as the ratio of DT length (metamere 6–10) to body length, normalized against WT embryos (ratio taken as 1). Tube length of mtf mutants (n = 20), a gene encoding a bona fide SJ component, is increased. (C) WT, ykiB5, and ykiB5;btl>yki late stage 17 embryos. Gas filling of the DT lumen is observed in WT and ykiB5;btl>yki, but not in ykiB5 mutant embryos. Scale bar: 20 µm. (D) Plot showing the percentage of ykiB5 mutant (n = 99) embryos with gas-filling defects, which is significantly different from WT (n = 86) and ykiB5;btl>yki embryos (n = 106). (E) The relative tube length of ykiB5 mutant embryos is rescued to different extents by expression of either yki or Diap1 by btl-Gal4. WT (n = 20), ykiB5 (n = 11), ykiB5;btl>yki (n = 12), ykiB5;btl>Diap1(n = 12). Error bars represent SEM. (F–H′) Airyscan confocal images showing the DT (tracheal metamere 7) of WT (F and F′), ykiB5 (G and G′) and mtf (H and H′) mutants of late stage 16 stained for the core SJ components Yurt and Cora (green), the luminal matrix protein Serp (magenta), and the nucleus with DAPI (blue). Note that Cora and Yurt are apically restricted in WT and ykiB5 mutant tracheae, but not in mtf mutants. Scale bar: 10 µm. (I–K′) Transmission electron microscopy of stage 16 embryonic tracheae of WT (I and I′), ykiB5 (J and J′), and mtf (K and K′) mutants. Electron-dense septa (arrows) are comparable in WT and ykiB5 but invisible in mtf mutants. Scale bars: 0.5 µm. Error bars represent SEM.
Figure 2.
Figure 2.
Yki is important for transepithelial barrier function. (A–C) Fluorescent 10-kD Dextran injected into the body cavity does not enter the tracheal lumen (dotted yellow line) of stage 17 WT embryos (A). In contrast, the dye leaks into the tracheal lumen in ykiB5 (B) mutant embryos. In ykiB5 embryos expressing Yki in the tracheae, the dye is excluded from the lumen (C). Scale bar: 50 µm. (D) Plot representing the percentage of embryos with leakage defects. Shown are the results for ykiB5 (n = 115), WT (n = 172), and ykiB5; btl>yki (n = 62) embryos. (E–G″) Time series of Dextran-injected embryos. Dextran accumulates gradually in the tracheal lumen of ykiB5 mutant embryos (F–F′″), as compared with mtf mutant embryos (G–G′″), where the dye accumulates a few minutes after injection and stays unchanged over time. Scale bar: 100 µm. (H) Quantification of the relative luminal Dextran intensity 60 min after injection. WT (n = 75), ykiB5 (n = 72), mtf (n = 70). (I) Quantification of the relative luminal Dextran intensity 240 min after injection. WT (n = 83), ykiB5 (n = 88), mtf (n = 80). Error bars represent SEM.
Figure 3.
Figure 3.
The apical barrier breaks down in yki mutant embryos. (A–D) Projections of confocal sections of tracheal DTs of stage 17 embryos. The dityrosine network marking the apical barrier (magenta) is reduced in AlasKG10015 (A) and ykiB5 (C) mutant embryos, whereas the signal is markedly increased in mutant embryos expressing Alas by btl-GAL4 (B and D). Arrows indicate dityrosine apical staining. Scale bars: 20 µm. (A′–D′) Whole-mount embryos at early stage 17. The DT of AlasKG10015 (A′) and ykiB5 (C′) mutant embryos are not air filled. In contrast, expression of Alas with the tracheal-specific driver btl-GAL4 rescues the air filling defects of both mutants (B′ and D′). Scale bars: 20 µm. (E) Plot showing the percentage of AlasKG10015 (n = 45) and ykiB5 (n = 50) mutant embryos with gas-filling defects, and significant rescue of this defect in both mutants upon tracheal-specific expression of Alas (ykiB5;btl>Alas, n = 42; AlasKG10015;btl>Alas, n = 50). (F) Plot showing the percentage of embryos with defects in the barrier function of the DT, as measured by 10 kD Rhodamine-dextran leakage into to the lumen. ykiB5 (n = 41), ykiB5;btl>Alas (n = 38), AlasKG10015 (n = 41) AlasKG10015;btl>Alas (n = 30). (G) Quantification of anti-dityrosine intensity as a measure for the apical extracellular barrier. ykiB5 (n = 15), ykiB5;btl>Alas (n = 11), AlasKG10015 (n = 13) AlasKG10015;btl>Alas (n = 11). (H) Quantitative real-time RT-PCR showing a significant difference in pan-embryonic Alas mRNA levels between WT and ykiB5 mutants at stage 17. No significant difference was detected in duox mRNA levels. ykiB5 (n = 200), WT (n = 200). Three biological replicates were performed per genotype per gene. (I) Quantification of δ-ALA concentration in WT (400), ykiB5 (400), and AlasKG10015 (400) stage 17 embryos. Three biological replicates were performed per genotype. Error bars represent SEM.
Figure 4.
Figure 4.
Tsr and Yki interact. (A) Tsr coimmunoprecipitates with Yki from embryo lysates expressing Yki-V5 in tracheal cells. btl-Gal4 alone was used as a negative control. IP, immunoprecipitate; WB, Western blot. (B–C″) PLA of Tsr and Yki in wing imaginal discs. Wing discs from en>GFP,yki-V5 (control) and en>GFP,yki-V5,tsr were labeled with anti-V5 and anti-Tsr to perform PLA assays. The Yki-V5 expression domain is marked by GFP. (D–D″) BiFC of Yki and Tsr complexes in wing imaginal discs. (D) Depicted are the relative BiFC intensity of complexes as compared with control. (D′) GFP fluorescence upon Yki and Tsr complex formation (n = 19). (D″) Negative control (n = 16). Error bars represent SEM. Scale bars: 50 µm.
Figure 5.
Figure 5.
Tsr and Yki act in interconnected pathways to regulate tracheal tube elongation. (A–E) Loss of function of tsr (B) causes convoluted DT, similar to loss of yki (C). (D) This phenotype is enhanced in tsrk05633; ykiB5 double mutants. Scale bar: 50 µm. (E) Quantification of DT length of WT (n = 10), ykiB5 (n = 11), tsrk05633 (n = 9), and tsrk05633; ykiB5 (n = 8) mutants. The DT of tsrk05633; ykiB5 double mutants is significantly longer than that of ykiB5 and tsrk05633 single mutants. (F–M) Tracheal expression of either Tsr (H and L) or Yki (I and M) using btl-Gal4 rescues DT elongation defects of tsrk05633 (H and I) and ykiB5 (L and M) mutants. Scale bar: 20 µm. (N) Relative expression of tsr mRNA in WT, ykiB5 and tsrk05633 mutant embryos at stage 17. tsr mRNA levels are not significantly altered in the absence of yki. 200 embryos were used per genotype. Three biological replicates were performed per genotype. (O) Relative expression of yki mRNA in WT, ykiB5, and tsrk05633 mutant embryos of stage 17. yki mRNA levels are not significantly altered in the absence of Tsr. 200 embryos were used per genotype. Three biological replicates were performed per genotype. (P) Western blot of protein lysates from WT, ykiB5, and tsrk05633 mutant embryos at stage 17. Note that the protein levels of Tsr and Yki are reduced in the respective other mutant. (Q and R) Quantification of the immunoblot in (P) using Fiji, based on the intensity of Yki (Q) and Tsr (R) protein, normalized to the loading control (α-Tubulin; n = 3). (S) Relative expression of diap1 mRNA in WT, ykiB5, and tsrk05633 mutant embryos at stage 17. Results were normalized to an endogenous control (actin-5C). Note that Diap1 is significantly down-regulated in yki mutants but significantly up-regulated in tsr mutants. 200 embryos were used per genotype. Three biological replicates were performed per genotype. Error bars represent SEM.
Figure 6.
Figure 6.
Yki and Tsr are maternally contributed. (A) Western blot of protein lysates from unfertilized eggs of ykiB5 and tsrk05633 heterozygote females. (B) Western blots from cell lysates of S2 cells expressing Yki and Tsr, treated with cycloheximide (CHX) for 0–6 h. Tubulin is used as a loading control. (C) Degradation kinetics (N(t)=N0eλt), derived from B, shows the level of Vn-Yki in S2 cells after protein synthesis inhibition by cycloheximide. 0–18 refer to hours after CHX addition. Data were collected from two independent experiments. (D) Cofilin knockdown in HEK293T cells expressing GFP-Cofilin reduces YAP total protein levels as well as YAP phosphorylation at S381 and S127. Tubulin was used as loading control.
Figure 7.
Figure 7.
Tsr regulates Yki nuclear localization and the expression of its target gene, diap1. (A–D) tsr mutant tracheal cells of stage 17 embryos show increased levels of Yki-target gene Diap1-lacZ (A) as compared with the control (B). In contrast, ykiB5 mutant tracheal cells of stage 17 embryos (C) show absent of Diap1-lacZ, whereas tracheal cells overexpressing Yki show increased levels of Diap1-lacZ (D). (E) Relative expression of diap1, expanded (ex), and Myc mRNA in WT, ykiB5, and yki-overexpressing embryos of stage 17. Results were normalized to an endogenous control (actin-5C). 200 embryos were used per genotype. Three biological replicates were performed per genotype per gene. Error bars represent SEM.
Figure 8.
Figure 8.
Apical membrane expansion contributes to tube over-elongation in yki and tsr mutant embryos. (A–D″) Stage 17 WT (A–A″ and C–C″) and ykiB5 mutant (B–B″ and D–D″) embryos stained with Uif to label the apical membrane (A′–D′ and A″–D″, magenta) and Perlecan to label the basement membrane (A–D and A″–D″, green). Scale bars: 20 µm. (E–L) Stage 17 embryos stained with Ed to outline the apical surface of DT cells. Scale bars: 10 µm. (M) Quantification of the apical surface of ykiB5 and control embryos. A significant increase of the apical surface area is observed in ykiB5 mutants compared with WT. Apical surface area is restored upon tracheal-specific expression of tsr or yki in ykiB5 mutant embryos. ykiB5 (n = 45), ykiB5;btl>Tsr (n = 32), ykiB5;btl>Yki (n = 25), WT (n = 38). Error bars represent SEM. (N) Quantification of the apical surface of tsrk05633 and control embryos. A significant increase of the apical surface area is observed in tsrk05633 mutants compared with WT embryos. Apical surface area is restored upon tracheal-specific expression of tsr or yki in tsrk05633 mutant embryos. WT (n = 31), tsrk05633 (n = 48), tsrk05633;btl>Tsr (n = 25), tsrk05633;btl>Yki (n = 27). Error bars represent SEM.
Figure 9.
Figure 9.
Yki is enriched apically in DT cells and mutants of tsr and yki exhibit increased apical F-actin. (A–D′) Maximum intensity projections of stage 17 embryos expressing Utrophin-GFP (A–D) and Lifeact-RFP (btl>Lifeact-RFP; A′–D′) to show the apical F-actin enrichment in WT (A, A′, C, and C′), tsrk05633 (B and B′), and ykiB5 (D and D′) mutants. Scale bars: 20 µm. (F–F″′) Live imaging of mKate2-Yki dynamics during late tracheal development using endogenous mKate2-Yki. Apical Yki intensity increases with time (yellow arrowheads). Scale bar: 100 µm. (G–H′) Confocal images of WT (G and G′) and ykiB5 mutant (H and H′) embryos stained with anti-Yki (G and H) and WGA (green; G′ and H′) to label the lumen (outlined by dashed lines). In WT embryos, Yki is enriched at the apical cortex (marked by red dashed line) of tracheal cells (G), whereas ykiB5 mutants completely lack Yki cortical labeling (H). Scale bar: 10 µm.
Figure 10.
Figure 10.
Yki shows the highest concentration at the apical membrane of DT cells. (A) Cortical and cytoplasmic sections of the tracheal lumen of stage 17 embryos expressing Yki-GFP by btl-Gal4. Scale bars: 5 µm. (B) Schematic representation of the different tracheal cell areas in which the concentration of Yki-GFP was determined by FCS. (C) Relative Yki-GFP concentrations in WT and tsrk05633 trachea cells, determined by FCS in the cortical and cytoplasmic sections, as well as in the nucleus. (D) Relative fractions of slowly diffusing Yki-GFP molecules in WT and tsrk05633 trachea cells, measured by FCS. A relatively higher amount of slowly diffusing Yki-GFP molecules is found in the cortex as compared with the cytoplasmic area or the nucleus, suggesting more pronounced stabilization in the cortex. (E) Average FCS curves of Yki-GFP in WT and tsrk05633 trachea cells in the cortex, cytoplasm, and nucleus. The concentration increases from nucleus to cytoplasm to cortex, as shown also in C. (F) Normalized average FCS curves to the same amplitude, G(τ) = 1, allow comparison of the diffusion of Yki-GFP in WT and tsrk05633 tracheal cells in the investigated cellular compartments. Yki-GFP displays increasingly slower diffusion from the nucleus to the cytoplasm to the cortex (n = 36 cells). (G) Average FCS curves of mKate2-Yki and Yki-GFP in tsr mutants (tsrk05633,ykiB5; yki-GFP [BAC]) in the cortex, cytoplasm, and nucleus. The concentration increases from nucleus to cytoplasm to cortex in WT cells whereas it decreases in tsrk05633,ykiB5 mutant cells. n = 20–30 counts per sample. Error bars represent SEM. (H) Normalized average FCS curves to the same amplitude, G(τ) = 1, allow comparison of the diffusion of mKate2-Yki and Yki-GFP (expressed from a rescuing BAC transgene) in yki,tsr mutants (tsrk05633,ykiB5; yki-GFP [BAC]) in the investigated cellular compartments. mKate2-Yki displays increasingly slower diffusion from the nucleus to the cytoplasm to the cortex (n = 27 cells), whereas Yki-GFP in the yki,tsr mutants shows the opposite behavior. Error bars represent SEM. (I and J) Tracheal tubes of stage 16 WT yki-GFP (BAC; I) and tsrk05633,ykiB5; yki-GFP (BAC; J), stained with GFP (white) and the luminal marker Gasp (magenta). Yellow arrows indicate the apical accumulation of Yki. Scale bars: 10 µm. (K–M) Model. (K) In WT cells, Yki (green) and Tsr (blue) cooperate in the apical cell cortex to regulate membrane size and subsequently tissue growth. Tsr is a negative regulator of Yki nuclear translocation. Only a small portion of Yki is able to localize to the nucleus and transcribe Yki-target genes (e.g., Diap1) necessary for tissue growth, or genes required for tissue water tightness and gas filling (e.g., Alas). F-Actin is marked in magenta. (L) In the absence of Yki, Tsr protein levels are reduced, resulting in increased apical F-actin (magenta) and membrane growth. Yki target genes for tissue growth and water tightness are no longer transcribed (crossed-out arrows), resulting in elongated tubes with defects in gas filing. (M) In the absence of Tsr, Yki protein levels are reduced and not maintained apically, allowing Yki molecules to translocate to the nucleus, resulting in stronger diap1 transcription (thicker arrows). However, higher Diap1 levels do not account for abnormal tube elongation. Rather, F-actin accumulates apically and apical membrane growth is increased, leading in longer tubes. F-Actin is marked in magenta. Asterisks delineate p-values as follows: *, P < 0.05; **, P < 0.01; ***, P < 0.001.

References

    1. Andrianantoandro E., and Pollard T.D.. 2006. Mechanism of actin filament turnover by severing and nucleation at different concentrations of ADF/cofilin. Mol. Cell. 24:13–23. 10.1016/j.molcel.2006.08.006 - DOI - PubMed
    1. Aragona M., Panciera T., Manfrin A., Giulitti S., Michielin F., Elvassore N., Dupont S., and Piccolo S.. 2013. A mechanical checkpoint controls multicellular growth through YAP/TAZ regulation by actin-processing factors. Cell. 154:1047–1059. 10.1016/j.cell.2013.07.042 - DOI - PubMed
    1. Bachmann A., Draga M., Grawe F., and Knust E.. 2008. On the role of the MAGUK proteins encoded by Drosophila varicose during embryonic and postembryonic development. BMC Dev. Biol. 8:55 10.1186/1471-213X-8-55 - DOI - PMC - PubMed
    1. Bamburg J.R. 1999. Proteins of the ADF/cofilin family: essential regulators of actin dynamics. Annu. Rev. Cell Dev. Biol. 15:185–230. 10.1146/annurev.cellbio.15.1.185 - DOI - PubMed
    1. Beitel G.J., and Krasnow M.A.. 2000. Genetic control of epithelial tube size in the Drosophila tracheal system. Development. 127:3271–3282. - PubMed

Publication types

MeSH terms