. 2019 Jul 17;10(1):3042.
doi: 10.1038/s41467-019-10759-z.

The longevity-promoting factor, TCER-1, widely represses stress resistance and innate immunity

Affiliations

The longevity-promoting factor, TCER-1, widely represses stress resistance and innate immunity

Francis R G Amrit et al. Nat Commun. .

Abstract

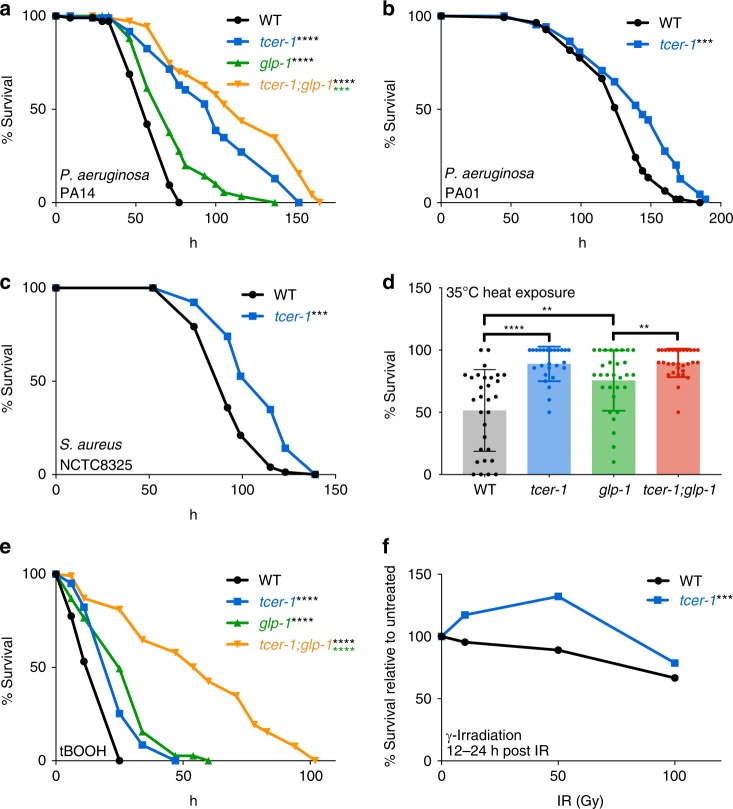
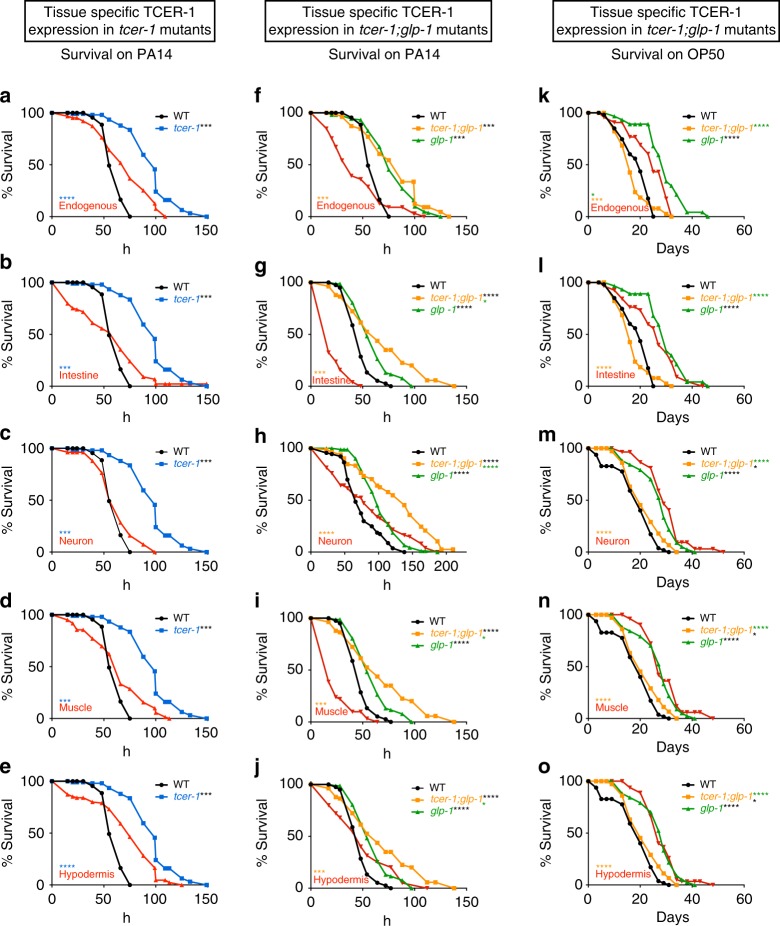
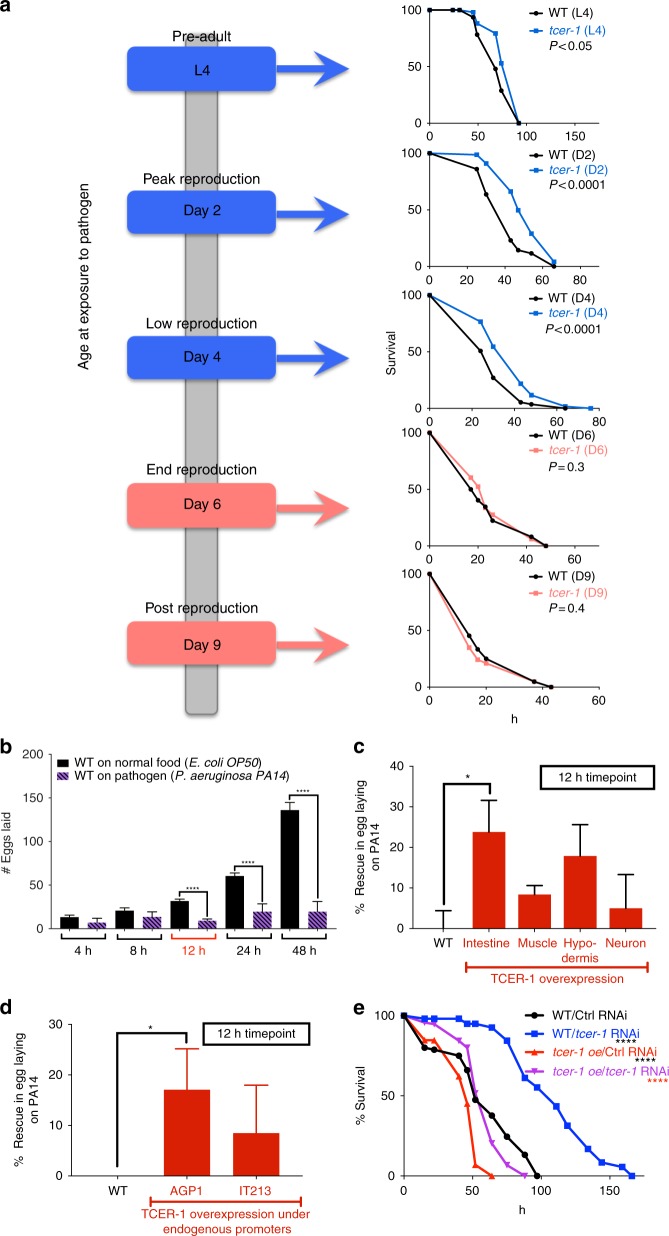
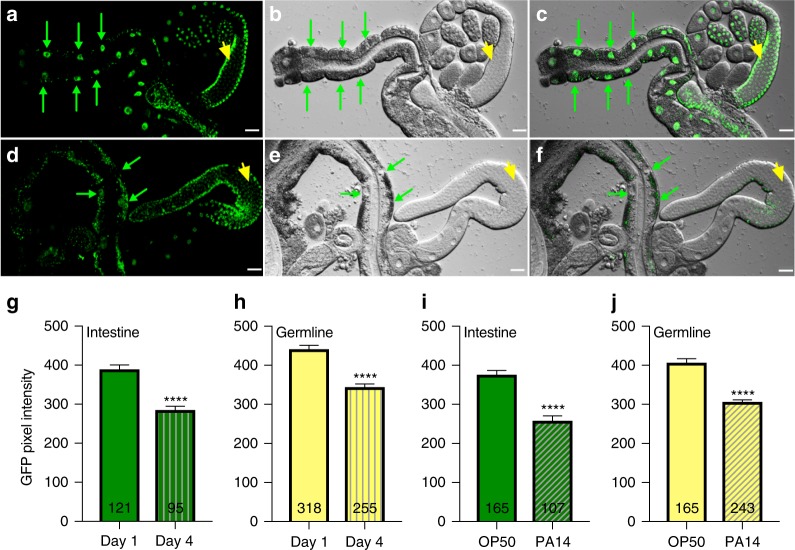
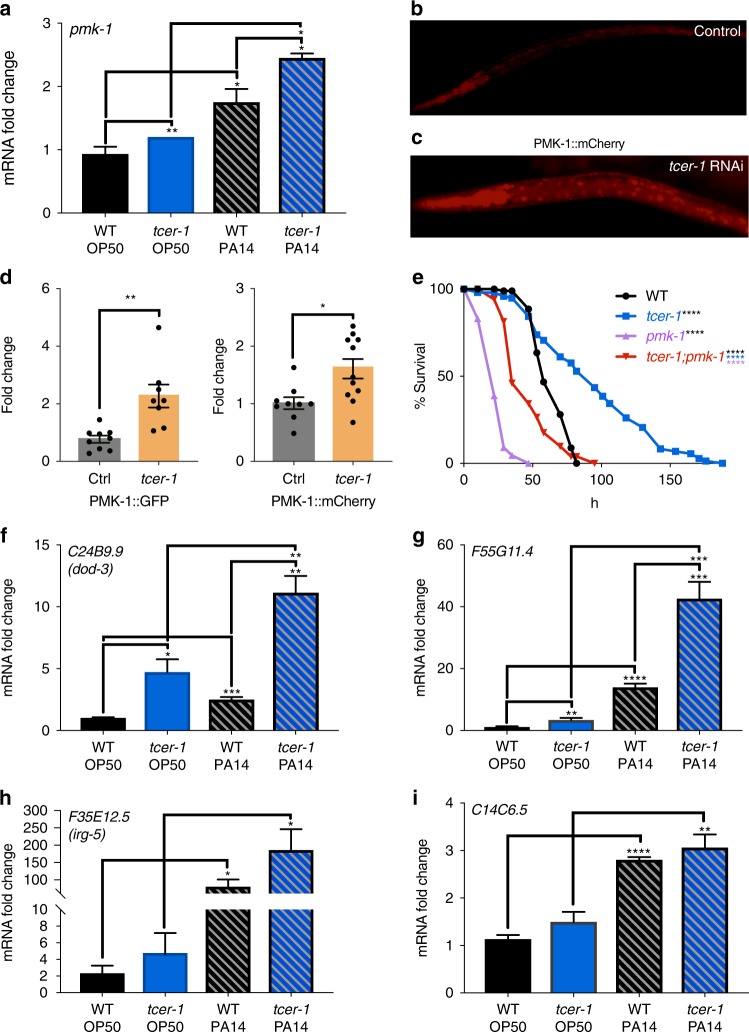
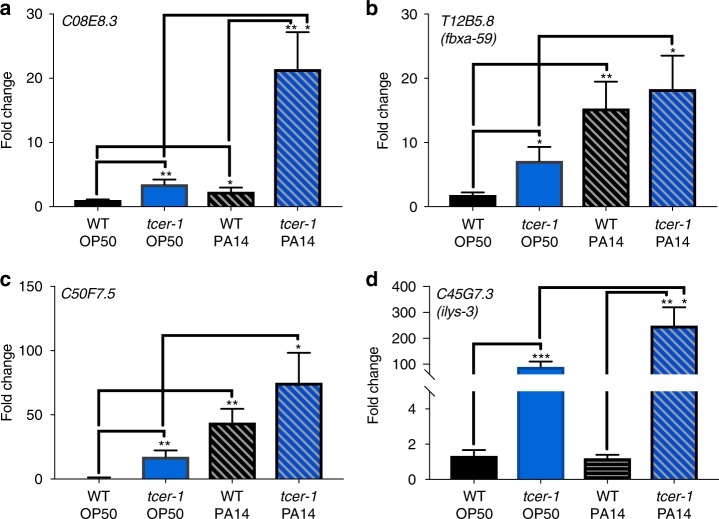
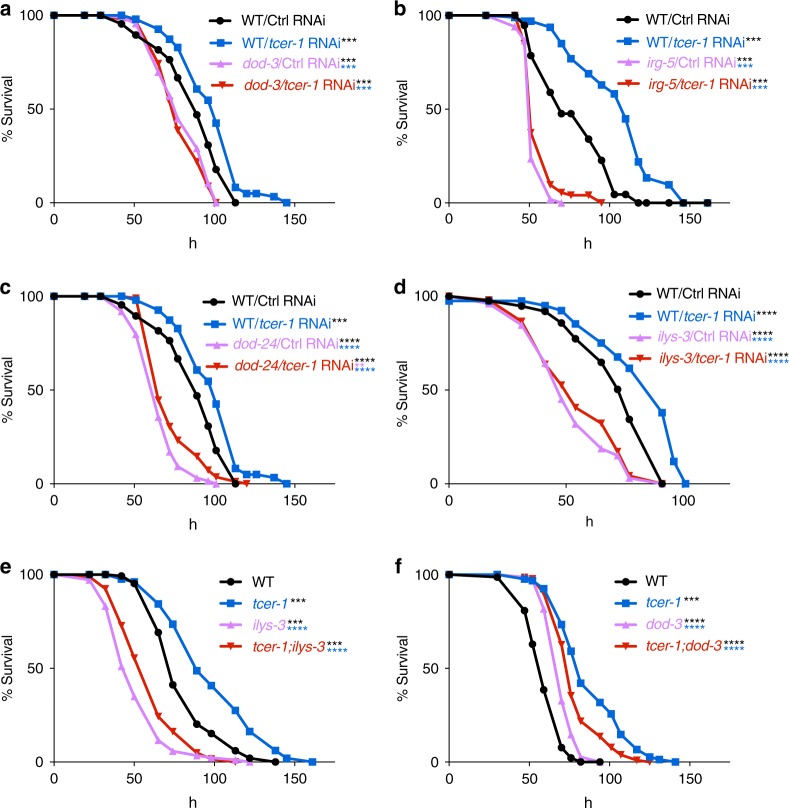
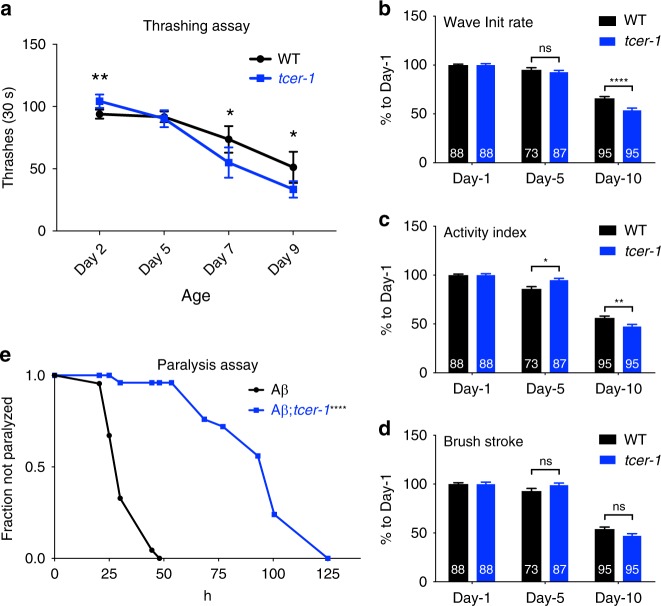
Stress resistance and longevity are positively correlated but emerging evidence indicates that they are physiologically distinct. Identifying factors with distinctive roles in these processes is challenging because pro-longevity genes often enhance stress resistance. We demonstrate that TCER-1, the Caenorhabditis elegans homolog of human transcription elongation and splicing factor, TCERG1, has opposite effects on lifespan and stress resistance. We previously showed that tcer-1 promotes longevity in germline-less C. elegans and reproductive fitness in wild-type animals. Surprisingly, tcer-1 mutants exhibit exceptional resistance against multiple stressors, including infection by human opportunistic pathogens, whereas, TCER-1 overexpression confers immuno-susceptibility. TCER-1 inhibits immunity only during fertile stages of life. Elevating its levels ameliorates the fertility loss caused by infection, suggesting that TCER-1 represses immunity to augment fecundity. TCER-1 acts through repression of PMK-1 as well as PMK-1-independent factors critical for innate immunity. Our data establish key roles for TCER-1 in coordinating immunity, longevity and fertility, and reveal mechanisms that distinguish length of life from functional aspects of aging.


Conflict of interest statement

The authors declare no competing interests.

Figures

Fig. 1
Fig. 1
Loss of TCER-1 enhances resistance against multiple biotic and abiotic stressors. Survival of L4 stage, wild-type C. elegans (WT, black), tcer-1 (blue), glp-1 (green) and tcer-1;glp-1 (orange) mutants exposed to different stressors. ac Pathogen exposure. a P. aeruginosa PA14: WT (m = 59.35 ± 1.3, n = 89/106), tcer-1 (m = 98.6 ± 3.5, n = 83/109, P vs. WT <0.001), glp-1 (m = 72.86 ± 2.1, n = 102/109, P vs. WT <0.0001) and tcer-1;glp-1 (m = 114.18 ± 3.9, n = 81/106, P vs. glp-1 <0.001). b P. aeruginosa PA01: WT (m = 126.43 ± 2.4, n = 118/142), tcer-1 (m = 139.98 ± 2.7, n = 143/173, P vs. WT <0.001). c S. aureus: WT (m = 94.67 ± 1.5, n = 97/111), tcer-1 (m = 109.27 ± 1.5, n = 145/169, P vs. WT <0.001). d Heat stress: survival of day 2 adults 12 h after exposure to 35 °C for 6 h. n = 50−100 animals per strain per each of six biological replicates analyzed using unpaired two-tailed t test. e Oxidative stress: survival of L4 animals in 7 mM t-BOOH. WT (m = 17.32 ± 1.1, n = 57/98), tcer-1 (m = 25.65 ± 1.7, n = 33/100, P vs. WT <0.0001), glp-1 (m = 27.88 ± 1.4, n = 79/100, P vs. WT <0.0001) and tcer-1;glp-1 (m = 56.31 ± 5.1, n = 29/100, P vs. glp-1 <0.0001). f DNA damage: viability of eggs laid by day 1 hermaphrodites 24 h after exposure to 50 Gy γ-irradiation, n = 9−20. P 0.003 in unpaired t test. In (ac) and e, survival data analyzed using Kaplan−Meier test, shown as mean lifespan in hours (m) ± standard error of the mean (SEM). ‘n’ refers to number of animals analyzed/total number in experiment (see Methods for details). P values adjusted for multiplicity where applicable. Asterisks indicate statistical significance <0.01 (**), <0.001 (***) and <0.0001 (****) and their color denotes the strain of comparison. Data from additional trials presented in Supplementary Tables 1A, B (panel a), 2A, B (b, c), 3A (e) and Supplementary Fig. 1d (f)
Fig. 2
Fig. 2
TCER-1 acts cell non-autonomously to suppress immunity and promote longevity. aj TCER-1 expression in any somatic tissue suppresses PA14 resistance. Mean survival (hours) of L4 larvae transferred to PA14. ae Expression in tcer-1 mutants. Wild type (WT, black, 60.68), tcer-1 (blue, 96.31) and tcer-1 mutants expressing TCER-1 (red) under control of a endogenous promoter (70.91) or promoters expressed in b intestine (gly-19, 55.3), c neurons (rgef-1, 62.32), d muscles (myo-3, 64.0) or e hypodermis (col-12, 71.67). fj Expression in tcer-1;glp-1 mutants. f Native expression. Wild type (WT, 60.68), glp-1 (79.2), tcer-1;glp-1 (orange, 80.3) and tcer-1;glp-1 mutants expressing TCER-1 under the control of endogenous promoter (44.0). gj Tissue-specific expression. WT (47.61), glp-1 (59.52), tcer-1;glp-1 (67.98) and tcer-1;glp-1 mutants expressing TCER-1 (red) under the control of promoters expressed in g intestine (22.45), i muscles (25.03) or j hypodermis (47.15). h Neurons: WT (75.3), glp-1 (102.34), tcer-1;glp-1 (126.59) and neuron-expressed TCER-1 (84.31). ko TCER-1 expression in any somatic tissue extends tcer-1;glp-1 mutant’s lifespan on OP50. Mean survival (days) on OP50. k, l WT (18.7), glp-1 (29.32), tcer-1;glp-1 (17.11) and tcer-1;glp-1 mutants expressing TCER-1 under k endogenous promoter (24.14) and l tissue-specific expression in intestine (25.66). mo WT (18.44), glp-1 (27.35), tcer-1;glp-1 (21.46) and tcer-1;glp-1 mutants expressing TCER-1 in m neurons (29.98), n muscles (29.26) and o hypodermis (28.14). Survival data analyzed using Kaplan−Meier test. P values adjusted for multiplicity where applicable. Asterisks indicate statistical significance <0.05 (*), <0.001 (***) and <0.0001 (****) and their color denotes the strain of comparison. Assays in some panels were conducted in the same biological replicate so their controls are shared. Details of number of animals and data from additional trials in Supplementary Tables 4A (panels a–e), 4B (f–j) and Supplementary Data 1 (k–o)
Fig. 3
Fig. 3
TCER-1 links fertility and immunity. a TCER-1 does not inhibit immunity in post-reproductive adults. Schematic on left indicates age at which animals were transferred to PA14 plates. Mean survival (hours) upon PA14 exposure as L4 larvae: wild type (WT, black: 71.69), tcer-1 (blue: 79.97), reproductively active adults (blue): day 2: WT (40.89), tcer-1 (51.36), day 4: WT (31.41), tcer-1 (38.86) and at post-reproductive ages (pink): day 6: WT (24.82), tcer-1 (26.17) or day 9: WT (20.91), tcer-1 (19.6). b Fertility reduction caused by PA14. Egg-laying dynamics of late L4 larvae transferred to PA14 (purple, hashed) or control E. coli OP50 (black, solid). c, d Decline in egg laying caused by PA14 is limited by overexpressing TCER-1. Y-axes show percent rescue in egg laying 12 h after PA14 exposure by strains overexpressing TCER-1 (red bars, X-axes) in c individual somatic tissues or d under control of tcer-1 endogenous promoters, as compared to the 65% reduction in egg laying shown by WT (baseline). To control for differences in brood sizes, number of eggs laid by each strain on PA14 was normalized to its brood size on OP50. For assays (bd), data combined from 2 to 10 biological replicates with 10−20 animals per strain per replicate. Statistical significance calculated using two-tailed, unpaired t test. Error bars denote standard error. e TCER-1 overexpression increases PA14 susceptibility. Survival (hours) of wild-type on control vector (WT/Ctrl, black; m = 57.47, n = 68/100) or tcer-1 RNAi (WT/tcer-1, blue, m = 108.46, n = 100/100) and endogenous promotor-driven TCER-1 transgenic strain (tcer-1 o/e) on control (tcer-1 oe/Ctrl, red; m = 43.46, n = 68/85) or tcer-1 RNAi (tcer-1 oe/tcer-1, purple, m = 57.96, n = 83/116). Survival data analyzed using Kaplan−Meier test. Asterisks indicate statistical significance <0.05 (*), and <0.0001 (****) and color denotes the strain of comparison. P values adjusted for multiplicity where applicable. Details of number of animals in panel a and data from additional trials in Supplementary Table 5
Fig. 4
Fig. 4
TCER-1 levels in intestine and germ cells are reduced with age and PA14 exposure. TCER-1::GFP expression in the nuclei of intestinal cells (green arrows) and germ cells (yellow arrowhead) visualized in dissected wild type, day 1 (ac) or day 4 (df) C. elegans; the corresponding images, visualized by differential contrast interference (DIC) microscopy, and GFP-DIC overlaps, are shown in (b, c) and (e, f), respectively. By day 4, expression is significantly diminished in most intestinal nuclei (compare green arrowheads, quantified in g) while a more modest reduction is visible in germ-cell nuclei (quantified in h). Note: By day 4, some intestinal nuclei showed no visible GFP and the quantification does not take these into account. A similar reduction in GFP levels in intestinal nuclei (i) as well as germ-cell nuclei (j) was exhibited in day 1 adults 12 h after exposure to PA14 (hashed bars in i and j), as compared to age-matched controls animals on OP50 (solid bars in i and j). “n” signifies the total number of nuclei in which GFP intensity was measured from intestines (from 9 to 19 adults per strain per condition) and germlines (from 7 to 13 adults per strain per condition) (see Supplementary Fig. 8 for additional quantification). Asterisks represent the statistical significance of the differences in expression in an unpaired, two-tailed t test with P values <0.0001 (****). Error bars represent standard error of the mean
Fig. 5
Fig. 5
TCER-1 suppresses immunity by inhibiting PMK-1. a mRNA levels of pmk-1 measured by QPCR in day 1 wild-type (black) and tcer-1 mutant (blue) adults maintained on OP50 (solid bars) or exposed as L4s to PA14 for 8 h (hashed bars). bd PMK-1::mCherry reporter strain grown on b empty control vector or c tcer-1 RNAi from egg until larval stage L4 then transferred to PA14 for 24 h. d PMK-1::mCherry quantification from (c) and similar imaging of PMK-1::GFP strain upon tcer-1 RNAi. Data combined from three biological replicates with 15–20 animals imaged per strain per replicate. e pmk-1 null mutation suppresses tcer-1 mutant’s PA14 resistance. Survival of wild-type animals (WT, black m = 63.49 ± 1.3, n = 75/100), tcer-1 (blue, m = 93.82 ± 4.4, n = 84/100, P vs. WT <0.0001), pmk-1 (m = 23.77 h ± 0.8, n = 92/100, P vs. WT <0.001) and tcer-1;pmk-1 mutants (m = 45.95 ± 1.8, n = 97/102, P vs. tcer-1 <0.001, P vs. pmk-1 <0.0001, P vs. WT <0.0001) on PA14 after development on OP50 till L4 stage. fi Expression of PMK-1 target genes is upregulated in tcer-1 mutants. Q-PCR analysis of mRNA levels of known PMK-1-upregulated genes f dod-3, g F55G11.4, h irg-5 and i C14C6.5 measured after wild-type (WT, black) and tcer-1 mutants (blue) grown on OP50 till L4 stage were transferred to PA14 plates for 12 h (hashed bars) or continued on OP50 (solid bars). Data in (a) and (fi) combined from three independent biological replicates, each including three technical replicates. Error bars represent standard error of the mean (SEM). Survival data in panel (e) calculated using the Kaplan−Meier test and shown as mean lifespan in hours (m) ± SEM (see Methods for details). In (a, d and fi) statistical significances were calculated using a one-tailed t test. P values were adjusted for multiplicity where applicable. Asterisks indicate the degree of statistical significance <0.05 (*), <0.01 (**), <0.001 (***) and <0.0001 (****) and their color denotes the strain/condition of comparison
Fig. 6
Fig. 6
TCER-1 inhibits immunity by repressing PMK-1- independent genes. Gene expression measured by Q-PCRs of wild-type animals (black) and tcer-1 mutants (blue) grown on OP50 till L4 stage and then exposed to PA14 (hashed bars) or retained on OP50 for 12 h. ad Expression of PMK-1-independent immunity genes C08E8.3 (a), fbxa-59 (b), C50F7.5 (c) and ilys-3 (d). Data combined from 2 to 5 independent biological replicates, each including three technical replicates. Statistical significance of the differences in expression was calculated using a one-tailed t test. Error bars represent standard error of the mean. *P < 0.05, **P < 0.01, ***P < 0.001
Fig. 7
Fig. 7
TCER-1-repressed genes are essential for resistance against PA14. Survival of wild-type L4 animals grown from egg stage on empty control vector (black, WT/Ctrl) or tcer-1 RNAi bacteria (blue, WT/tcer-1) and then transferred to PA14 plates compared to the survival of a dod-3, b irg-5, c dod-24 or d ilys-3 mutants grown on empty control vector (pink curves) or tcer-1 RNAi bacteria (red). a WT/Ctrl (m = 87.63 ± 2.2), WT/tcer-1 (m = 99.27 ± 2.1), dod-3/Ctrl (m = 79.95 ± 1.5), dod-3/tcer-1 (m = 78.8 ± 1.4). b WT/Ctrl (m = 77.67 ± 3.0), WT/tcer-1 (m = 104.62 ± 2.7), irg-5/Ctrl (m = 53.07 ± 0.7), irg-5/tcer-1 (m = 56.69 ± 1.2). c WT/Ctrl (m = 87.63 ± 2.2), WT/tcer-1 (m = 99.27 ± 2.1), dod-24/Ctrl (m = 66.18 ± 1.4), dod-24/tcer-1 (m = 74.20 ± 1.5). d WT/Ctrl (m = 72.12 ± 2.3), WT/tcer-1 (m = 81.33 ± 2.5), ilys-3/Ctrl (m = 52.15 ± 1.9), ilys-3/tcer-1 (m = 55.21 ± 2.0). e Survival of wild type and mutants transferred to PA14 plates at L4 stage. WT (black, m = 88.05 ± 2.0), tcer-1 (blue, m = 111.81 ± 2.3), ilys-3 (pink, m = 54.29 ± 1.3) and tcer-1;ilys-3 (m = 60.74 ± 1.5). f WT (m = 60.06 ± 0.8), tcer-1 (m = 87.9 ± 2.0), dod-3 (m = 70.87 ± 0.75) and tcer-1;dod-3 (m = 79.06 ± 1.3). Survival estimated using the Kaplan−Meier analysis and shown as mean lifespan in hours (m) ± standard error of the mean (SEM). P values were adjusted for multiplicity where applicable. Asterisks indicate statistical significance <0.01 (**), <0.001 (***) and <0.0001 (****) and their color denotes the strain of comparison. Assays in panels (a) and (c) were performed in the same biological replicate so their controls are shared. Details of number of animals and data from additional trials are presented in Supplementary Table 6
Fig. 8
Fig. 8
Young tcer-1 mutants exhibit improvement in some healthspan parameters. a Thrashing efficiency compared between wild-type (WT, black) and tcer-1 mutants (blue) at different ages. Data shown are combined from six independent biological replicates with 20 animals tested per strain, per replicate. Statistical significance was calculated using an unpaired two-tailed t test. bd Measurement of change in swimming parameters with age in wild-type C. elegans (WT, black) and tcer-1 mutants (blue) quantified using CeleST. In this longitudinal assay, the differences seen between the strains on day 1 of adulthood were not replicated but a clear reduction in day 10 tcer-1 mutants’ wave initiation rate (b, number of body waves initiated per minute) and activity index (c, measure of overall swimming activity) was observed. Brush stroke (d, depth of movement) was also reduced in the mutants but not in a statistically significant manner. Data combined from three independent biological replicates with number of animals tested for each genotype indicated on the bars. Statistical significance was calculated using two-way Anova, error bars represent standard error of the mean. e Loss of tcer-1 delays paralysis in Aβ proteotoxicity model. Onset of paralysis measured in the amyloid β proteotoxicity model strain GMC101 (Aβ, black) and Aβ strain carrying a tcer-1 mutation (Aβ;tcer-1, blue). Kaplan−Meier analysis for mean paralysis time: Aβ m = 33.1 h, n = 67; Aβ;tcer-1 m = 95 h, n = 25. Asterisks indicate statistical significance <0.05 (*), <0.01 (**), and <0.0001 (****), ns not significant. Data from additional trials in Supplementary Fig. 9

References

    1. Zhou KI, Pincus Z, Slack FJ. Longevity and stress in Caenorhabditis elegans. Aging (Albany NY) 2011;3:733–753. doi: 10.18632/aging.100367. - DOI - PMC - PubMed
    1. Murakami S. Stress resistance in long-lived mouse models. Exp. Gerontol. 2006;41:1014–1019. doi: 10.1016/j.exger.2006.06.061. - DOI - PubMed
    1. Epel ES, Lithgow GJ. Stress biology and aging mechanisms: toward understanding the deep connection between adaptation to stress and longevity. J. Gerontol. A Biol. Sci. Med. Sci. 2014;69(Suppl 1):S10–S16. doi: 10.1093/gerona/glu055. - DOI - PMC - PubMed
    1. Wang HD, Kazemi-Esfarjani P, Benzer S. Multiple-stress analysis for isolation of Drosophila longevity genes. Proc. Natl Acad. Sci. USA. 2004;101:12610–12615. doi: 10.1073/pnas.0404648101. - DOI - PMC - PubMed
    1. Munoz MJ, Riddle DL. Positive selection of Caenorhabditis elegans mutants with increased stress resistance and longevity. Genetics. 2003;163:171–180. - PMC - PubMed

Publication types

MeSH terms

Substances