. 2019 Jul 17;10(1):3134.
doi: 10.1038/s41467-019-10966-8.

Inactivating mutations and X-ray crystal structure of the tumor suppressor OPCML reveal cancer-associated functions

Affiliations

Inactivating mutations and X-ray crystal structure of the tumor suppressor OPCML reveal cancer-associated functions

James R Birtley et al. Nat Commun. .

Abstract

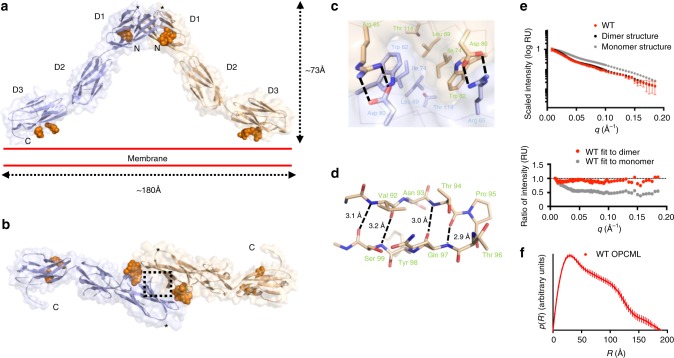
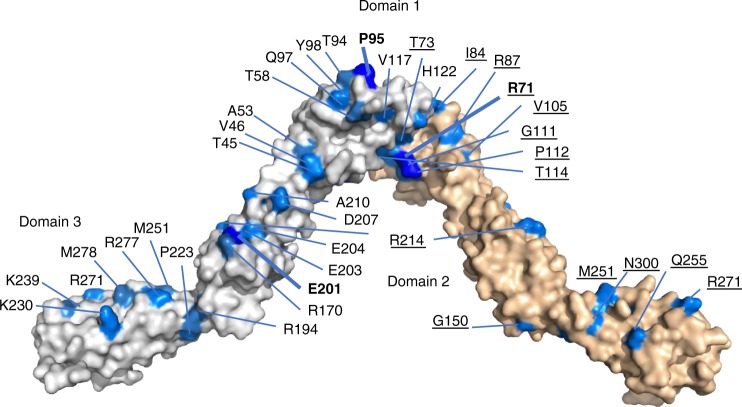
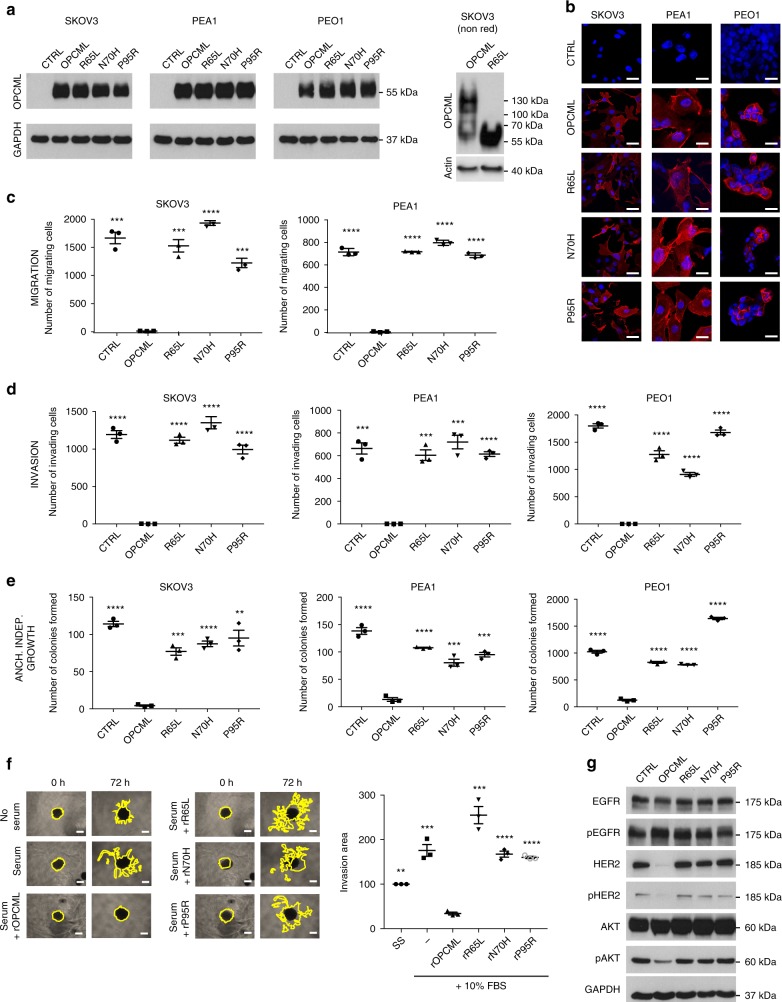
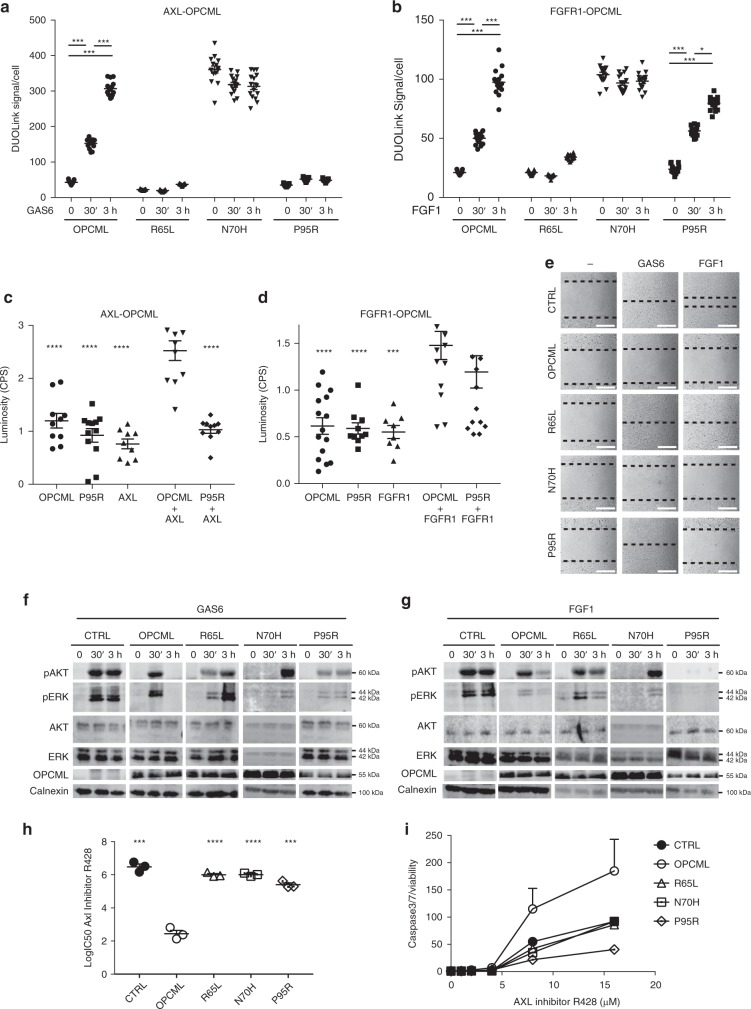
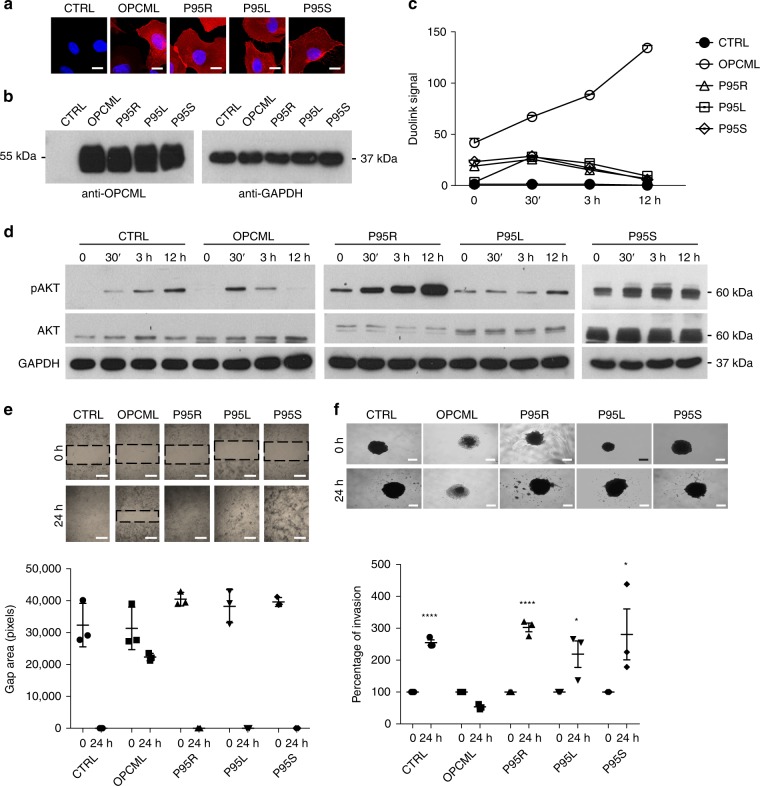
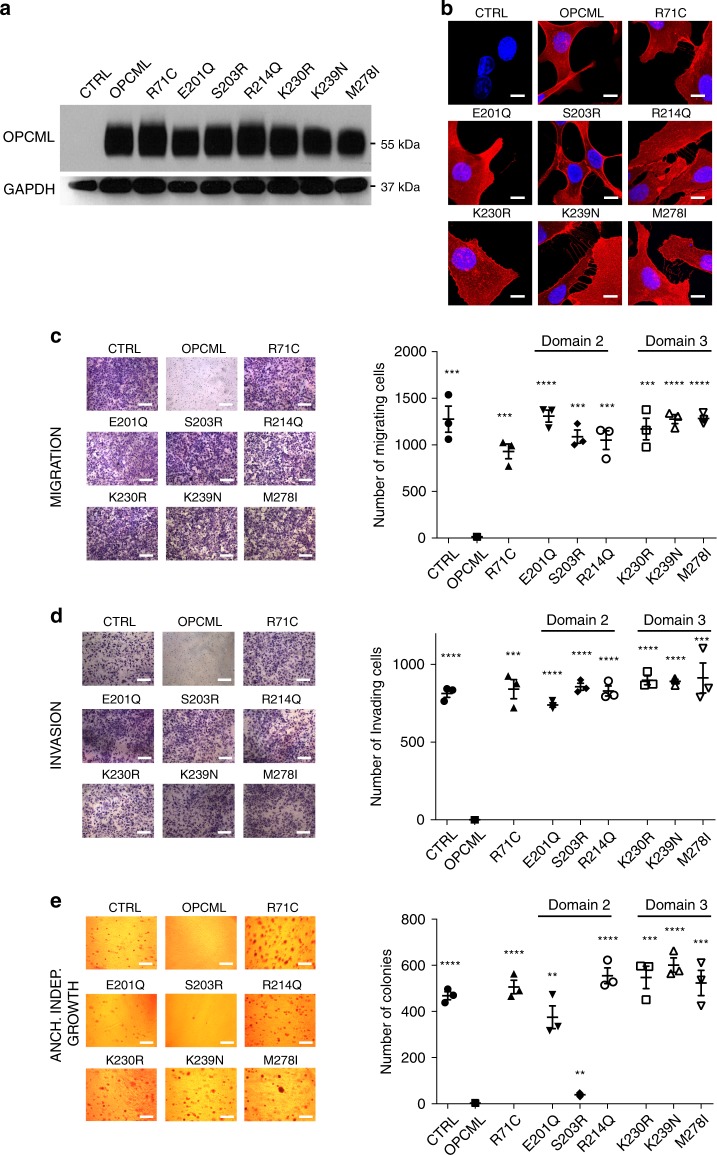
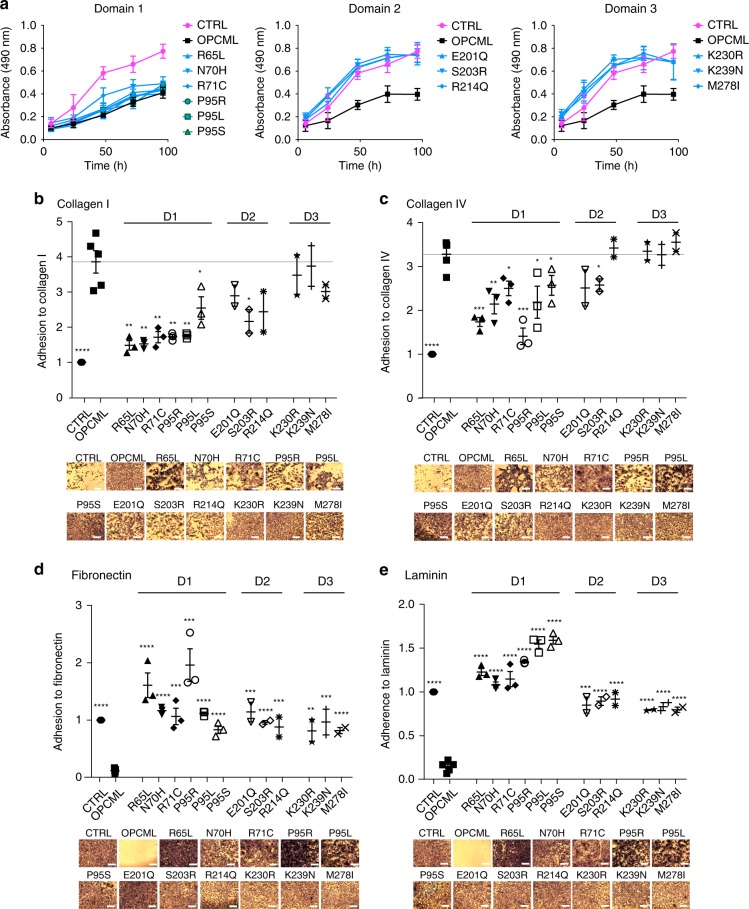
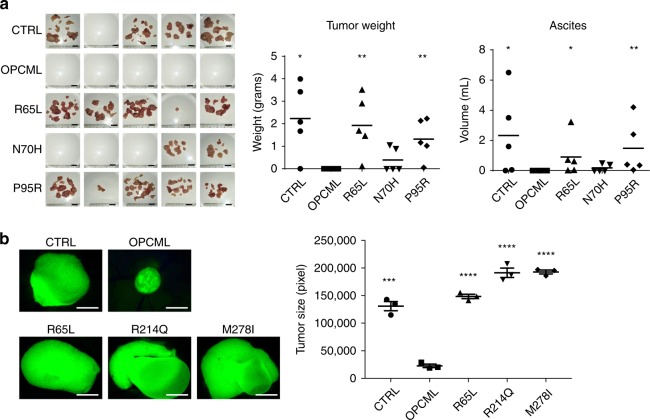
OPCML, a tumor suppressor gene, is frequently silenced epigenetically in ovarian and other cancers. Here we report, by analysis of databases of tumor sequences, the observation of OPCML somatic missense mutations from various tumor types and the impact of these mutations on OPCML function, by solving the X-ray crystal structure of this glycoprotein to 2.65 Å resolution. OPCML consists of an extended arrangement of three immunoglobulin-like domains and homodimerizes via a network of contacts between membrane-distal domains. We report the generation of a panel of OPCML variants with representative clinical mutations and demonstrate clear phenotypic effects in vitro and in vivo including changes to anchorage-independent growth, interaction with activated cognate receptor tyrosine kinases, cellular migration, invasion in vitro and tumor growth in vivo. Our results suggest that clinically occurring somatic missense mutations in OPCML have the potential to contribute to tumorigenesis in a variety of cancers.


Conflict of interest statement

H.G. is a VP head of Oncology Clinical Discovery at AstraZeneca (Concurrent with his position as Imperial College London tenured chair in medical oncology) and has ownership interest (including patents) in Patent to develop OPCML-based therapeutics. The remaining authors declare no competing interests.

Figures

Fig. 1
Fig. 1
Crystal structure of the OPCML homodimer. a Ribbon representation overlaid on a transparent surface illustrating the dimeric architecture of OPCML. One monomer is colored blue and the other wheat. N-linked glycosylation (on asparagines 70, 293, and 306) are shown as orange spheres. Location of P95 indicated by asterisk. N- and C- termini are indicated. Red parallel lines show the relative orientation of OPCML to the plasma membrane (on the extracellular side). Scale bars are shown to illustrate maximum dimensions. b Represented the same as in a but viewed from the top. The dashed rectangle represents key residues at the dimerization interface and these are shown in detail in c. c The D1-D1 homodimerization interface. Arg 65 from one monomer forms a salt bridge with Asp of the other monomer. Below Arg 65 is a stacking interaction involving Trp 82, Ile 74, Leu 69, and Thr 114. Same color scheme as in a, b . The alpha carbon backbone is shown as thin lines. d Stick representation of the β-turn encompassing residue P95, shown in wheat. Residues 92–94 and 97–99 form part of the D and E β–strands, respectively. Hydrogen bonds are indicated by dashed lines. e Small angle X-ray scattering analysis of WT OPCML. Scattering curves were measured and compared to calculated data of the dimer as seen in the crystal structure and of a monomeric model of OPCML. The fit to the dimer (χ = 0.50) matches more closely than to the monomer (χ = 2.35). f Pair-distance distribution function curve for WT OPCML. The curve intercepts the x-axis at R = 189 Å, indicating the maximum atomic distance in a single scattering particle. This model-independent parameter is consistent with the maximum manually measured dimension of the dimer structure (~180 Å), and is significantly larger than the maximum dimension of the monomer structure (~124 Å)
Fig. 2
Fig. 2
Mapping of the most common mutations on to the OPCML crystal structure homodimer. The OPCML homodimer is shown in space-filling representation with one monomer in white and the other wheat. Mutations associated with the wheat monomer are underlined. Mutations in domains 1 and 3 are drawn on the outside of the dimer, whilst domain 2 associated mutations are shown on the inside. The most commonly mutated sites (sites mutated 8 or 9 times) are shown in blue with the residue name in bold. Residues mutated 4, 5 or 6 times are shown in marine and residues mutated 3 times shown in sky blue. For simplicity, mutations found 1 or 2 times are not highlighted, with the exception of K230
Fig. 3
Fig. 3
R65L, N70H, and P95R mutants show loss of their tumor suppressor function in vitro. SKOV3, PEA1 and PEO1 ovarian cell lines were transduced with an empty vector (CTRL), wild-type (OPCML) or mutant (R65L, N70H, and P95R) OPCML and analyzed for protein expression by western blot (a) and protein expression/localization by confocal microscopy (b) with an anti-OPCML antibody. GAPDH or actin were used as loading controls in a. Samples in the right panel in a were run without heat denaturation. Scale bar = 20 μm. Cells were then tested for migration (c) and invasion (d) in transwell assays and for anchorage-independent growth in agarose (e). All the graphs show the mean ± s.d. of three independent experiments. Student t-test compares CTRL and mutants to wild-type OPCML: *p < 0.05, **p < 0.01, ***p < 0.001, ****p < 0.0001. f SKOV3 cells grown as spheroids were serum-starved, treated with the indicated recombinant proteins (rOPCML, rR65L, rN70H, rP95R), embedded into Matrigel and then stimulated with serum. Invasion of the spheroids was quantified after 3 days. Scale bar = 250 μm. The graphs show the mean ± s.e.m. of three independent experiments. Student t-test compares controls and mutant recombinant proteins to wild-type rOPCML: **p < 0.01, ***p < 0.001. g SKOV3 cells expressing the indicated wild-type and mutant OPCML were lysed and analyzed by western blot for the expression of total and phosphorylated levels of EGFR, HER2 and AKT. GAPDH was used as loading control
Fig. 4
Fig. 4
R65L, N70H, and P95R mutants interact differently with AXL and FGFR1. SKOV3 expressing an empty vector (CTRL), wild-type (OPCML) or mutant (R65L, N70H and P95R) OPCML were simulated for 30 min or 3 h with GAS6 (a) or FGF1 (b), and the interaction between OPCML and AXL (a) or OPCML and FGFR1 (b) was analyzed and quantified by Proximity Ligation Assay (DuoLink). The values from three independent experiments with five images each are shown all together. The bars indicate the mean ± s.e.m. Student t-test: *p < 0.05, ***p < 0.001. c, d Mammalian 2-hybrid assay. Cells were transfected with the indicated single constructs and the relative empty plasmids (not indicated), or with both plasmids expressing OPCML or P95R plus AXL (c) or plus FGFR1 (d). The bars indicate the mean ± s.e.m. calculated from the values of all the repeats from three independent experiments. Student t-test compared to wild-type OPCML plus AXL (c) or OPCML plus FGFR1 (d): ***p < 0.001, ****p < 0.0001. e Gap closure assay. SKOV3 cells expressing the indicated wild-type and mutant OPCML were serum starved and then left without stimulation (−) or stimulated with GAS6 or FGF1 as indicated. Migration was imaged after 15 h, and the migration front is highlighted by the dotted lines. Scale bar = 200 μm. f, g SKOV3 cells expressing the indicated wild-type and mutant OPCML were serum-starved and then stimulated with GAS6 (f) or FGF1 (g) for 30 min or 3 h. Cell lysates were analyzed by western blotting for the expression of total and phosphorylated AKT and ERK. Calnexin was used as loading control. h, i SKOV3 cells expressing the indicated wild-type and mutant OPCML were treated with the AXL inhibitor R428 for 2 days to assess the IC50 (h) or for 1 day to measure apoptosis (i). Student t-test compares CTRL and mutants to wild-type OPCML: ***p < 0.001, ****p < 0.0001. Both graphs show the mean ± s.e.m. of three independent experiments
Fig. 5
Fig. 5
Mutations at P95 show similar loss of tumor suppressor function and AXL interaction. SKOV3 cells were transduced with an empty vector (CTRL), wild-type (OPCML) or mutant (P95R, P95L, P95S) OPCML and analyzed for protein expression/localization by confocal microscopy (a) and protein expression by western blot (b) with an anti-OPCML antibody. Scale bar = 5 μm. Cells were starved and then stimulated with GAS6 for 30 min, 3 h or 12 h as indicated, and the interaction between OPCML and AXL measured by PLA (c), the signaling to pAKT detected by western blotting (d), the migration tested by gap closure assay (e) and the invasion studied by 3D spheroid invasion assay in Matrigel (f). GAPDH was used as loading control in b, d. The images were taken with a confocal microscope in a or an inverted microscope in e and f. Scale bar = 200 μm (e) and 250 μm (f). All the graphs show the mean ± s.e.m. of three independent experiments. Student t-test compares CTRL and mutants to wild-type OPCML at 24 h of invasion: *p < 0.05, ****p < 0.0001
Fig. 6
Fig. 6
Point mutations in D2 and D3 lead to loss of function. SKOV3 cells were transduced with an empty vector (CTRL), wild-type (OPCML) or mutant (R71C, E201Q, S203R, R214Q, K230R, K239N, M278I) OPCML and analyzed for protein expression by western blot (a) and protein expression/localization by confocal microscopy (b) with an anti-OPCML antibody. GAPDH was used as loading control in a. Scale bar = 5 μm. Cells were then tested for migration (c) and invasion (d) in transwell assays and for anchorage-independent growth in agarose (e). Scale bar = 50 μm (c, d) and 200 μm (e). All the graphs show the mean ± s.e.m. of three independent experiments. Student t-test compares CTRL and mutants to wild-type OPCML: **p < 0.01, ***p < 0.001, ****p < 0.0001
Fig. 7
Fig. 7
Different domains mediate distinct functions. a SKOV3 cells transduced with an empty vector (CTRL), wild-type (OPCML) or mutant (R65L, N70H, R71C, P95R, P95L, P95S in D1 in the left panel, E201Q, S203R, R214Q in D2 in the central panel, K230R, K239N, M278I in D3 in the right panel) OPCML were analyzed for proliferation. CTRL cells are represented in magenta, wild-type OPCML in black and the mutants in light blue. All the graphs show the mean ± s.d. of four independent experiments. be The different cell lines were plated onto collagen I (b), collagen IV (c), fibronectin (d) or laminin (e), and adhesion was tested after 1 h. Values have been normalized to CTRL. Scale bar = 50 μm. All the graphs show the mean ± s.e.m. of three independent experiments for domains 1 and 2 independent experiments for domains 2 and 3. Student t-test compares CTRL and mutants to wild-type OPCML: *p < 0.05, **p < 0.01, ***p < 0.001, ****p < 0.0001
Fig. 8
Fig. 8
Point mutations impair OPCML tumor suppressor function in in vivo models. a SKOV3 cells expressing empty vector (CTRL), wild-type (OPCML) or mutant (R65L, N70H and P95R) OPCML were injected intraperitoneally in five female athymic mice each. Tumors and ascites were collected and measured in grams and milliliters, respectively, as indicated. The mean is indicated by a line in the dot plots. Student t-test compares CTRL and mutants to wild-type OPCML: *p < 0.05, **p < 0.01. Scale bar = 1 cm. b SKOV3 cells expressing GFP and the indicated constructs were grown embedded in Matrigel on top of chick chorio–allantoic membranes. Tumors were excised, imaged and the GFP-positive area measured. Scale bar = 500 μm. The graph shows the mean ± s.e.m. of three eggs. Student t-test compares CTRL and mutants to wild-type OPCML: ***p < 0.001, ****p < 0.0001

References

    1. Cui Y, et al. OPCML is a broad tumor suppressor for multiple carcinomas and lymphomas with frequently epigenetic inactivation. PLoS One. 2008;3:e2990. doi: 10.1371/journal.pone.0002990. - DOI - PMC - PubMed
    1. Sellar GC, et al. OPCML at 11q25 is epigenetically inactivated and has tumor-suppressor function in epithelial ovarian cancer. Nat. Genet. 2003;34:337–343. doi: 10.1038/ng1183. - DOI - PubMed
    1. Baroy T, et al. Reexpression of LSAMP inhibits tumor growth in a preclinical osteosarcoma model. Mol. Cancer. 2014;13:93. doi: 10.1186/1476-4598-13-93. - DOI - PMC - PubMed
    1. Ntougkos E, et al. The IgLON family in epithelial ovarian cancer: expression profiles and clinicopathologic correlates. Clin. Cancer Res. 2005;11:5764–5768. doi: 10.1158/1078-0432.CCR-04-2388. - DOI - PubMed
    1. McKie AB, et al. The OPCML tumor suppressor functions as a cell surface repressor-adaptor, negatively regulating receptor tyrosine kinases in epithelial ovarian cancer. Cancer Disco. 2012;2:156–171. doi: 10.1158/2159-8290.CD-11-0256. - DOI - PMC - PubMed

Publication types