. 2019 Jul 17;9(1):10369.
doi: 10.1038/s41598-019-46594-x.

SREBP1-dependent de novo fatty acid synthesis gene expression is elevated in malignant melanoma and represents a cellular survival trait

Affiliations

SREBP1-dependent de novo fatty acid synthesis gene expression is elevated in malignant melanoma and represents a cellular survival trait

Su Wu et al. Sci Rep. .

Abstract

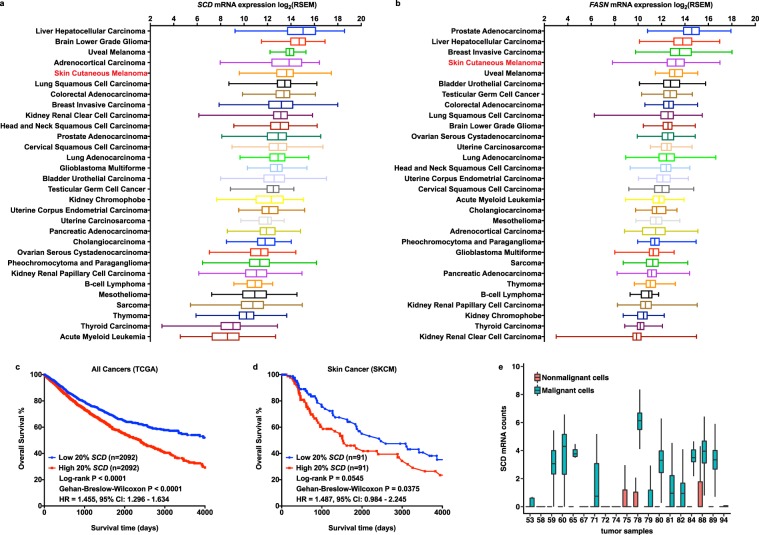
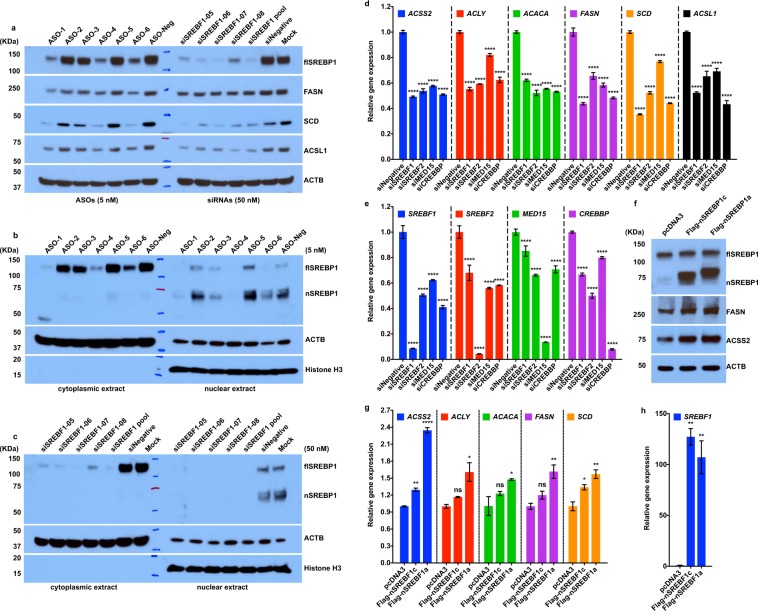
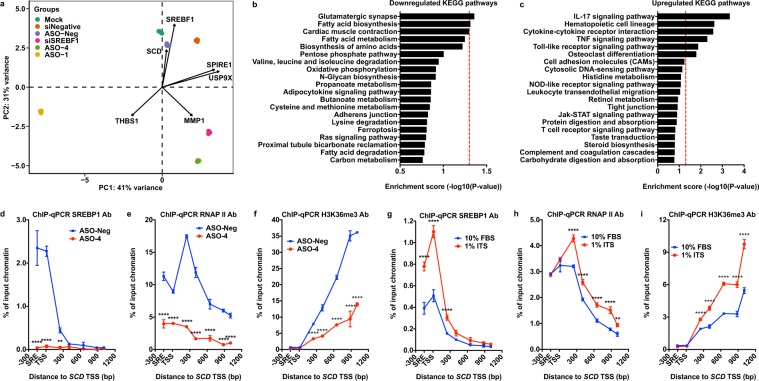
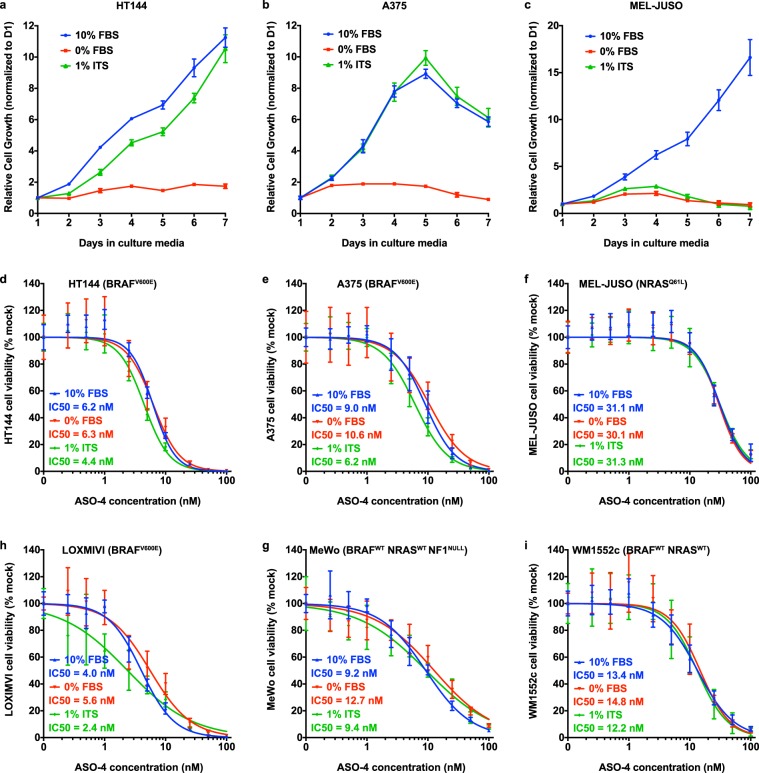
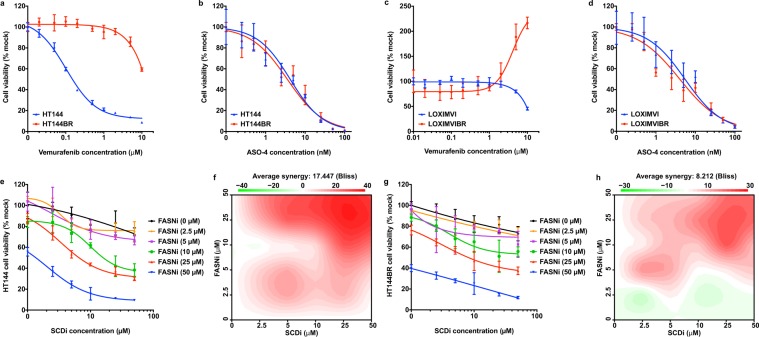
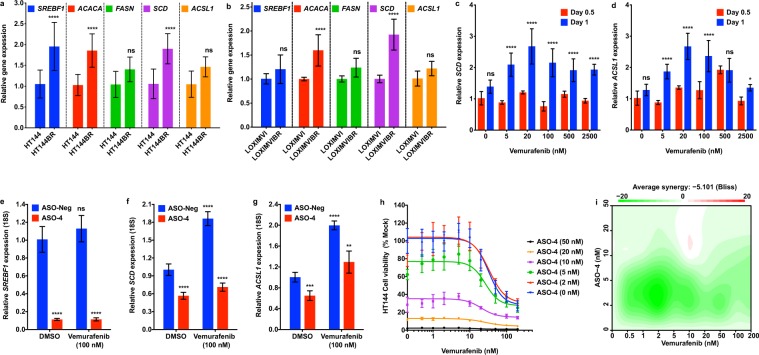
de novo fatty acid biosynthesis (DNFA) is a hallmark adaptation of many cancers that supports survival, proliferation, and metastasis. Here we elucidate previously unexplored aspects of transcription regulation and clinical relevance of DNFA in cancers. We show that elevated expression of DNFA genes is characteristic of many tumor types and correlates with poor prognosis, especially in melanomas. Elevated DNFA gene expression depends on the SREBP1 transcription factor in multiple melanoma cell lines. SREBP1 predominantly binds to the transcription start sites of DNFA genes, regulating their expression by recruiting RNA polymerase II to promoters for productive transcription elongation. We find that SREBP1-regulated DNFA represents a survival trait in melanoma cells, regardless of proliferative state and oncogenic mutation status. Indeed, malignant melanoma cells exhibit elevated DNFA gene expression after the BRAF/MEK signaling pathway is blocked (e.g. by BRAF inhibitors), and DNFA expression remains higher in melanoma cells resistant to vemurafenib treatment than in untreated cells. Accordingly, DNFA pathway inhibition, whether by direct targeting of SREBP1 with antisense oligonucleotides, or through combinatorial effects of multiple DNFA enzyme inhibitors, exerts potent cytotoxic effects on both BRAFi-sensitive and -resistant melanoma cells. Altogether, these results implicate SREBP1 and DNFA enzymes as enticing therapeutic targets in melanomas.


Conflict of interest statement

The authors declare no competing interests.

Figures

Figure 1
Figure 1
Elevated expression of DNFA genes is prevalent in many cancers, including melanomas, and has prognostic value. (a,b) Expression of SCD and FASN genes was compared using RSEM normalized RNA-Seq data from 10,210 tumor samples downloaded from The Cancer Genome Atlas (TCGA). The box and whisker plots represent gene expression in 30 TCGA cancer types. (c,d) We divided patients into two groups based on the ranking of SCD mRNA expression from their tumor biopsies. Differences in overall survival rates were computed between patients with top 20% SCD RNA-Seq counts in their tumor samples and those with bottom 20% SCD expression, as Kaplan-Meier plots in all cancer patients and skin cancer patients (SKCM) from the TCGA dataset. (e) The boxplot shows average mRNA reads of SCD in 4,645 single cells from tumor samples of 19 melanoma patients (GSE72056). SCD expression was compared between malignant and nonmalignant cells.
Figure 2
Figure 2
SREBP1 regulates the elevated DNFA gene expression in melanoma cells. (a) HT-144 cells were treated with ASOs, individual siRNA agents or pooled siRNAs (all individual agents combined) to deplete SREBP1 in 1% ITS medium. Total cell lysates were assayed with immunoblot by the indicated antibodies. HT-144 cells were transfected with (b) ASOs, (c) individual siRNA agents or pooled siRNAs in 1% ITS medium. Nuclear and cytoplasmic extracts were isolated for Western blot analysis of full length (fl) and nuclear (n) SREBP1 protein after treatment. (d,e) HT-144 cells were transfected with the pooled siRNAs (50 nM) in 1% ITS medium for three days to deplete SREBF1, SREBF2, MED15 or CREBBP. RT-qPCR assay of mRNA shows relative expression of DNFA enzymes from siRNAs treatment groups to that of negative control siRNA treatment (siNegative). (fh) HT-144 cells were transfected with plasmids carrying the transcriptionally active N-terminal portion of SREBP1a (nSREBP1a), N-terminal portion of SREBP1c (nSREBP1c) or empty vector (pcDNA3) for two days. (f) Total cell lysate was analyzed by Western blot assay using the indicated antibodies. (g,h) mRNAs were analyzed with RT-qPCR assay. The bar graphs show the relative expression of DNFA enzymes to that of pcDNA3 (control) transfection group. Data are expressed as mean ± SD and quantified from triplicates. One-way ANOVA tests were performed. ns, not significant; *P < 0.05; **P < 0.01; ***P < 0.001; ****P < 0.0001.
Figure 3
Figure 3
SREBP1 regulates DNFA pathway genes through RNAP II recruitment and productive elongation. (a) mRNAs of HT-144 cells were sequenced after ASOs (5 nM) or pooled siRNAs (50 nM) treatment in 1% ITS medium for three days. RNA-Seq data were analyzed with DESeq2 and principal component analysis (PCA). (b,c) The top 20 enriched signaling and metabolic KEGG pathways were discovered from differentially expressed genes (siSREBF1 group vs siNegative group) in RNA-Seq analysis using Generally Applicable Gene-set Enrichment (GAGE) method. Red dash line marks P value = 0.05. (df) HT-144 cells were transfected with ASO-4 (5 nM) or the negative control ASO (5 nM), cultured in 1% ITS medium. Percentage of input DNA was compared between two treatments for the indicated antibodies at the 5′ promoter region of the SCD gene. (gi) ChIP-qPCR analyses detected DNA pulldown using indicated antibodies at the SCD gene in HT-144 cells. ChIP-qPCR signals were compared between cells cultured in 10% FBS and 1% ITS medium conditions. Data were presented as mean ± SD and quantified from triplicates. Two-way ANOVA tests were performed. ns, not significant; *P < 0.05; **P < 0.01; ***P < 0.001; ****P < 0.0001.
Figure 4
Figure 4
Reliance on DNFA for melanoma cell survival. (ac) Cell growth of three melanoma cell lines was measured with cell-titer glo assay in 10% FBS, 0% FBS or 1% ITS medium in a time-course experiment. Cell proliferation was measured by cell-titer glo assay every day for seven days in three medium conditions. (di) Melanoma cell lines were transfected with various doses of ASO-4. Cell viability was measured by cell-titer glo assay six days after ASO transfection in three medium conditions. ASO-4 treatment diminished viability in quiescent cells, which was observed on cells cultured in 0% FBS medium. (a–c) LOXIMVI is the most sensitive line to ASO-4 treatment in all three culture conditions, while MEL-JUSO is the least sensitive line.
Figure 5
Figure 5
DNFA supports survival in drug-resistant melanoma cells. (a,b) HT-144BR is a BRAF inhibitor resistant HT-144 cell line, which was derived after prolonged treatment with vemurafenib (2 μM) in 10% FBS medium for three months. Viability of HT-144 and HT-144BR cells responding to vemurafenib or ASO4 treatment in 10% FBS medium was assessed by cell titer-glo assay. (c,d) LOXIMVIBR is the BRAF inhibitor resistant LOXIMVI cell line, which was derived after prolonged treatment with vemurafenib (2 μM) in 10% FBS medium for three months. Viability of LOXIMVI and LOXIMVIBR cells responding to vemurafenib or ASO-4 treatment was assessed by cell titer-glo assay in 10% FBS medium. (eh) HT-144 and HT-144BR cells were co-treated with FASN inhibitor (FASNi) GSK 2194069 and SCD inhibitor (SCDi) MF-438 in 10% FBS medium or 10% FBS medium with vemurafenib (2 μM). (e,g) Cell viability was measured by cell titer-glo assay six days after treatment. (f,h) The combination responses for two DNFA enzyme inhibitors were evaluated with the Bliss independence model. Positive Bliss scores indicate synergy between two drugs.
Figure 6
Figure 6
Elevated DNFA expression accompanies drug resistance in BRAFi treated melanoma cells. (a) RT-qPCR assay compared the DNFA gene expression between HT-144 cells in 10% FBS medium and HT-144BR cells in 10% FBS medium with vemurafenib (2 μM). (b) RT-qPCR assay compared the DNFA gene expression between LOXIMVI cells in 10% FBS medium and LOXIMVIBR cells in 10% FBS medium with vemurafenib (2 μM). (c,d) HT-144 cells were treated with different dosages of vemurafenib for 0.5 or 1 day in 1% ITS medium. SCD expression was assayed by RT-qPCR analysis. Expression of SCD from all treatment groups was normalized to expression under DMSO treatment at day 0.5 (normalized as 1). Relative gene expression was compared between 0.5-day and 1-day treatment groups. Data were presented as mean ± SD and quantified from triplicates. Two-way ANOVA tests were performed. *P < 0.05; **P < 0.01; ***P < 0.001; ****P < 0.0001. (eg) HT-144 cells were transfected with ASO-4 (5 nM) and then treated with vemurafenib (100 nM) in 1% ITS medium for one day. RT-qPCR assay analyzed DNFA gene expression from treatment groups relative to expression under ASO-Neg and DMSO treatment at day 1 (normalized as 1). Data are presented as mean ± SD and quantified from triplicates. One-way ANOVA tests were performed. ns, not significant; *P < 0.05; **P < 0.01; ***P < 0.001; ****P < 0.0001. (h) HT-144 cells were transfected with ASO-4, and then treated in combination with vemurafenib. Cell viability was measured by cell titer-glo assay three days after combined treatment in 1% ITS medium. (i) The drug interaction in (h) was evaluated with the Bliss independence model.

References

    1. Cairns RA, Harris IS, Mak TW. Regulation of cancer cell metabolism. Nature reviews. Cancer. 2011;11:85–95. doi: 10.1038/nrc2981. - DOI - PubMed
    1. Vander Heiden MG, Cantley LC, Thompson CB. Understanding the Warburg effect: the metabolic requirements of cell proliferation. Science. 2009;324:1029–1033. doi: 10.1126/science.1160809. - DOI - PMC - PubMed
    1. Vander Heiden MG, DeBerardinis RJ. Understanding the Intersections between Metabolism and Cancer Biology. Cell. 2017;168:657–669. doi: 10.1016/j.cell.2016.12.039. - DOI - PMC - PubMed
    1. Currie E, Schulze A, Zechner R, Walther TC, Farese RV., Jr. Cellular fatty acid metabolism and cancer. Cell Metab. 2013;18:153–161. doi: 10.1016/j.cmet.2013.05.017. - DOI - PMC - PubMed
    1. Menendez JA, Lupu R. Fatty acid synthase and the lipogenic phenotype in cancer pathogenesis. Nature reviews. Cancer. 2007;7:763–777. doi: 10.1038/nrc2222. - DOI - PubMed

Publication types

MeSH terms