. 2019 Jul 17;9(1):10357.
doi: 10.1038/s41598-019-45938-x.

VCF2CNA: A tool for efficiently detecting copy-number alterations in VCF genotype data and tumor purity

Affiliations

VCF2CNA: A tool for efficiently detecting copy-number alterations in VCF genotype data and tumor purity

Daniel K Putnam et al. Sci Rep. .

Abstract

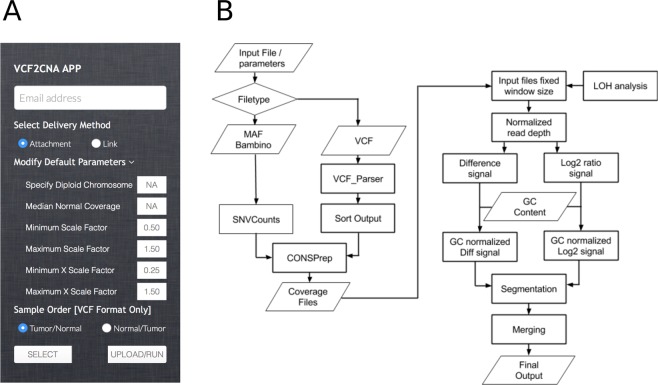
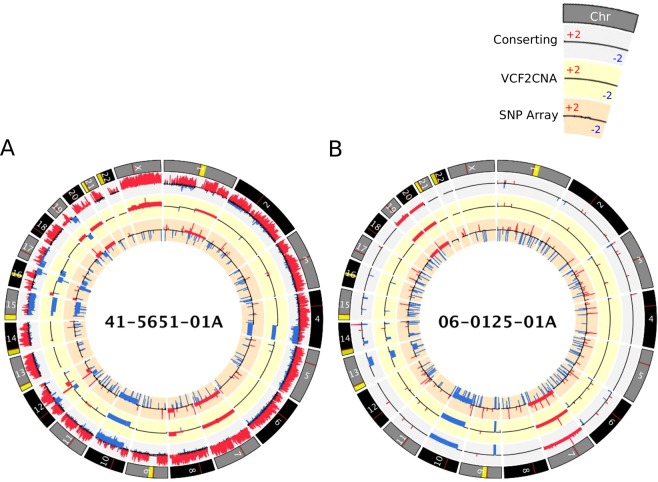
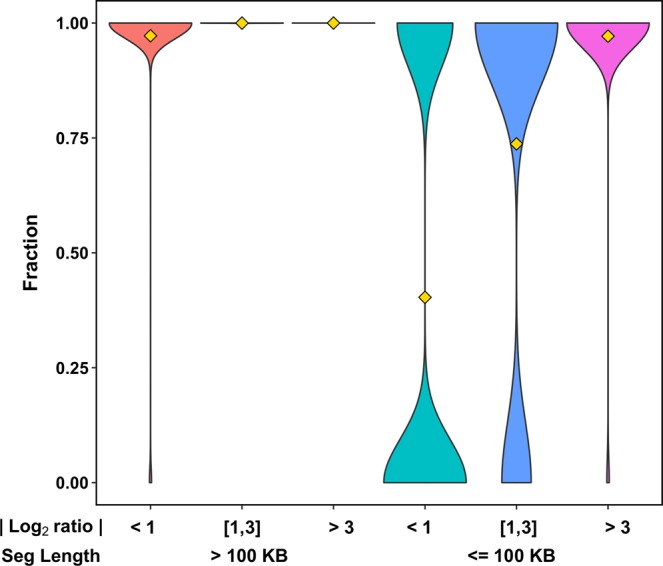
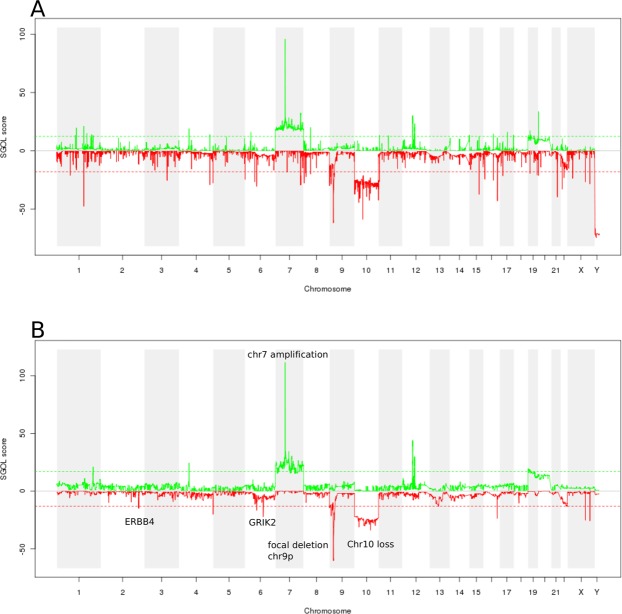
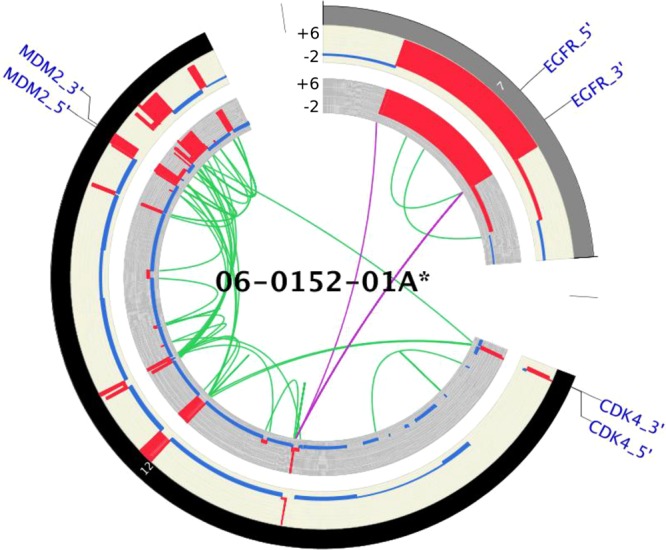
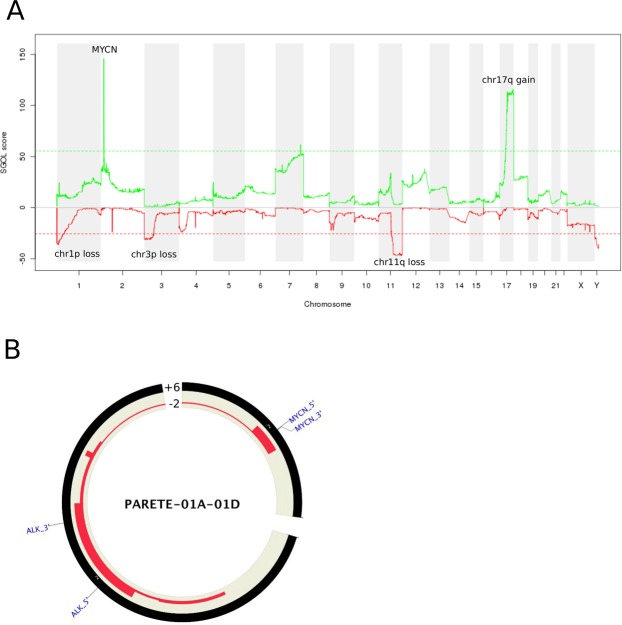
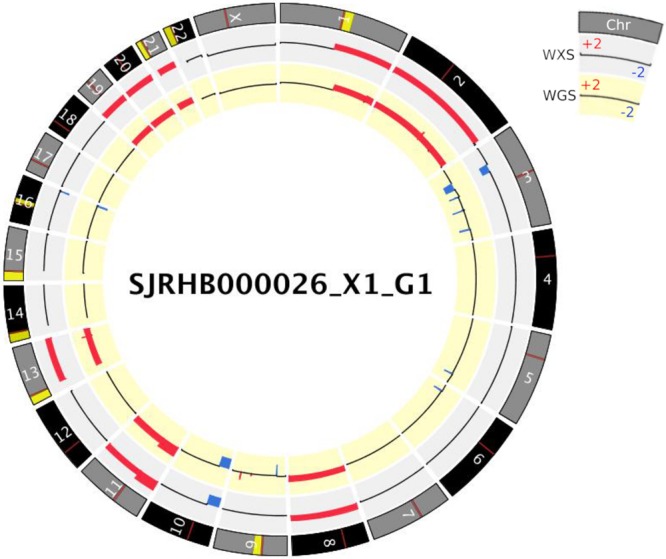
VCF2CNA is a tool (Linux commandline or web-interface) for copy-number alteration (CNA) analysis and tumor purity estimation of paired tumor-normal VCF variant file formats. It operates on whole genome and whole exome datasets. To benchmark its performance, we applied it to 46 adult glioblastoma and 146 pediatric neuroblastoma samples sequenced by Illumina and Complete Genomics (CGI) platforms respectively. VCF2CNA was highly consistent with a state-of-the-art algorithm using raw sequencing data (mean F1-score = 0.994) in high-quality whole genome glioblastoma samples and was robust to uneven coverage introduced by library artifacts. In the whole genome neuroblastoma set, VCF2CNA identified MYCN high-level amplifications in 31 of 32 clinically validated samples compared to 15 found by CGI's HMM-based CNA model. Moreover, VCF2CNA achieved highly consistent CNA profiles between WGS and WXS platforms (mean F1 score 0.97 on a set of 15 rhabdomyosarcoma samples). In addition, VCF2CNA provides accurate tumor purity estimates for samples with sufficient CNAs. These results suggest that VCF2CNA is an accurate, efficient and platform-independent tool for CNA and tumor purity analyses without accessing raw sequence data.


Conflict of interest statement

The authors declare no competing interests.

Figures

Figure 1
Figure 1
Overview of the VCF2CNA process. (A) User interface with parameters. (B) Server side pipeline. A parallelogram depicts input or output files, a rectangle depicts an analytical process, and a diamond depicts the condition for a follow-up process.
Figure 2
Figure 2
A Circos plot that displays CNAs found by CONSERTING (outer ring), VCF2CNA (middle ring), and SNP array (inner ring) for (A) TCGA-GBM fractured sample 41-5651-01A and (B) TCGA-GBM unfractured sample 06-0125-01A. Alternating gray and black chromosomes are used for contrast. Yellow regions depict sequencing gaps, whereas red regions depict centromere location. Blue segments depict copy-number loss, and red segments indicate copy-number gain. Legend depicts CNA range for each track.
Figure 3
Figure 3
Violin plot stratified by segment size and CNA intensity for all 22 TCGA-GBM unfractured samples. Gold diamond represents the mean fraction of matching segments between VCF2CNA and CONSERTING.
Figure 4
Figure 4
A chgMCR plot of 46 TCGA-GBM samples. (A) SNP array data and (B) VCF2CNA data are shown.
Figure 5
Figure 5
A Circos plot of VCF2CNA (outer ring) and CONSERTING (inner ring), depicting high-amplitude focal CNA segments in TCGA-GBM sample 06-0152-01A. Included in these segments are the known cancer genes EGFR, CDK4, and MDM2. CNA range is specified for each sample.
Figure 6
Figure 6
Analysis of the TARGET-NBL dataset, consisting of 146 tumors. (A) A chgMCR plot in which green depicts regions of copy-number gain and red depicts regions of copy-number loss. (B) A Circos plot showing a focal gain on chromosome 2 for MYCN and ALK5 for sample PARETE-01A-01D. CNA range is specified.
Figure 7
Figure 7
Somatic CNAs computed using VCF2CNA for paired whole-exome and whole-genome Rhabdomyosarcoma xenograph sample SJRHB000026_X1_G1.

Similar articles

Cited by

References

    1. Ciriello G, et al. Emerging landscape of oncogenic signatures across human cancers. Nat Genet. 2013;45:1127–1133. doi: 10.1038/ng.2762. - DOI - PMC - PubMed
    1. Groschel S, et al. A single oncogenic enhancer rearrangement causes concomitant EVI1 and GATA2 deregulation in leukemia. Cell. 2014;157:369–381. doi: 10.1016/j.cell.2014.02.019. - DOI - PubMed
    1. Hnisz D, et al. Activation of proto-oncogenes by disruption of chromosome neighborhoods. Science. 2016;351:1454–1458. doi: 10.1126/science.aad9024. - DOI - PMC - PubMed
    1. Northcott PA, et al. Enhancer hijacking activates GFI1 family oncogenes in medulloblastoma. Nature. 2014;511:428–434. doi: 10.1038/nature13379. - DOI - PMC - PubMed
    1. Peifer M, et al. Telomerase activation by genomic rearrangements in high-risk neuroblastoma. Nature. 2015;526:700–704. doi: 10.1038/nature14980. - DOI - PMC - PubMed

Publication types

MeSH terms