. 2019 Jul 17;9(1):10332.
doi: 10.1038/s41598-019-46841-1.

Changes in nuclear and cytoplasmic microRNA distribution in response to hypoxic stress

Affiliations

Changes in nuclear and cytoplasmic microRNA distribution in response to hypoxic stress

Tiia A Turunen et al. Sci Rep. .

Abstract

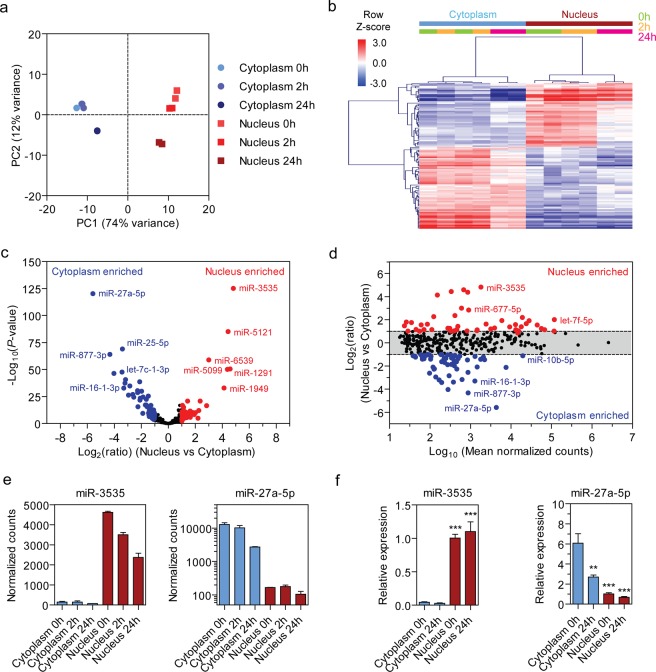
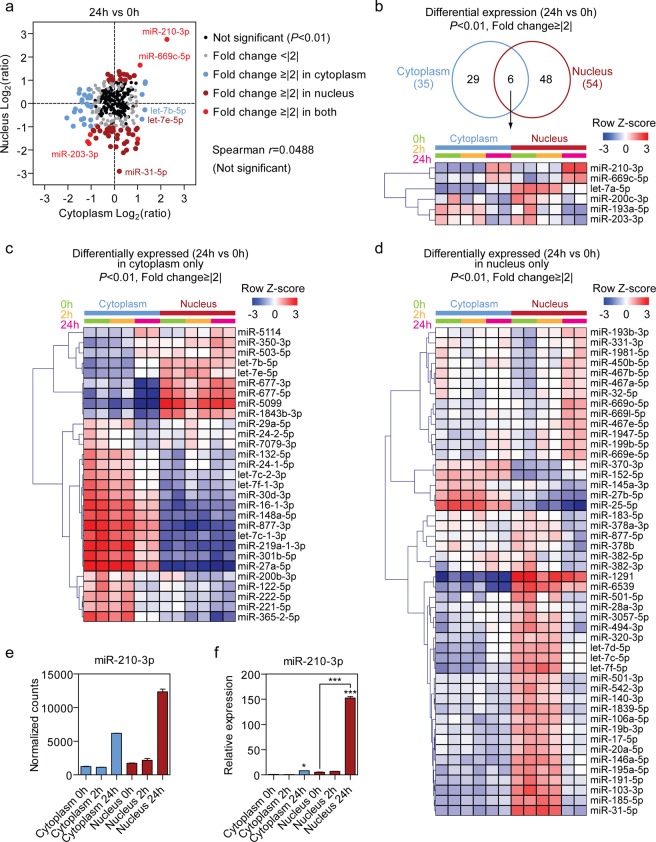
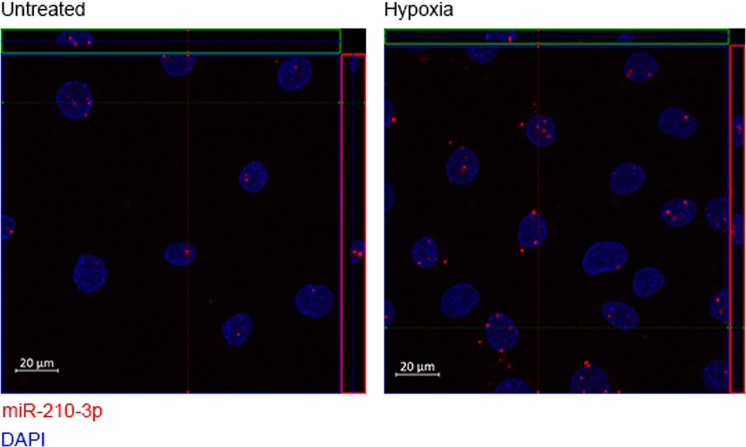
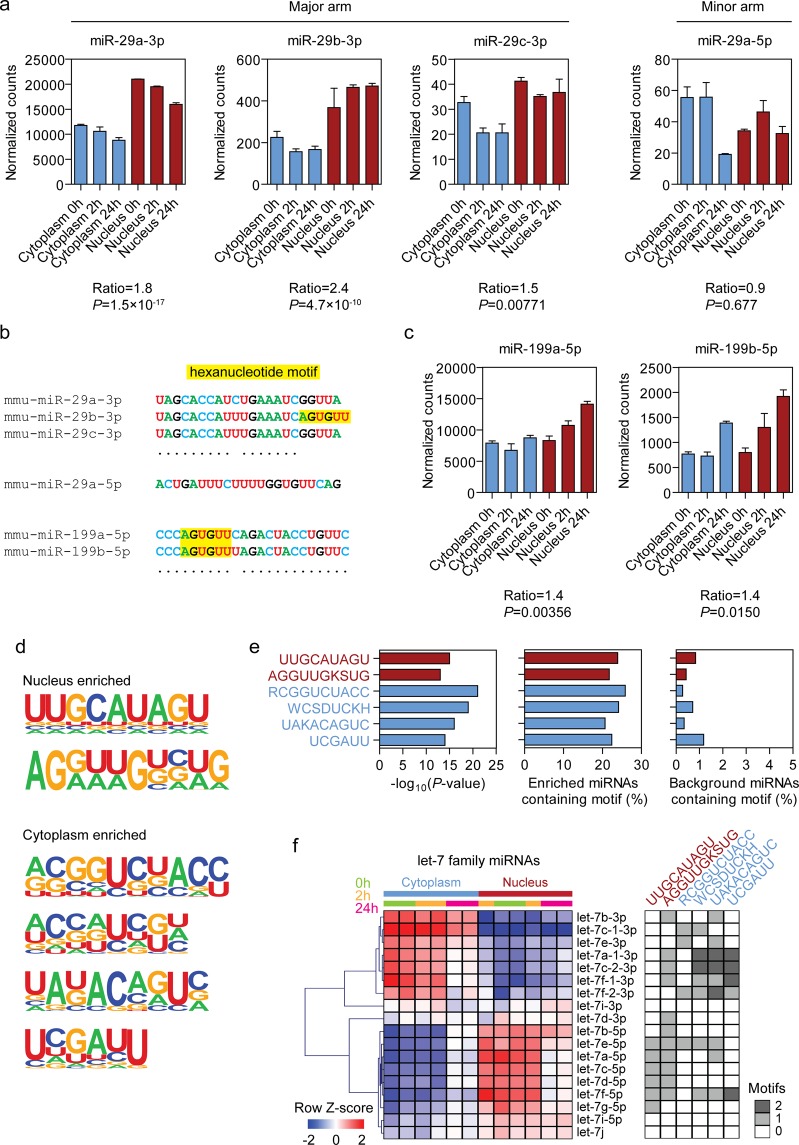
MicroRNAs (miRNAs) are small non-coding RNAs that have well-characterized roles in cytoplasmic gene regulation, where they act by binding to mRNA transcripts and inhibiting their translation (i.e. post-transcriptional gene silencing, PTGS). However, miRNAs have also been implicated in transcriptional gene regulation and alternative splicing, events that are restricted to the cell nucleus. Here we performed nuclear-cytoplasmic fractionation in a mouse endothelial cell line and characterized the localization of miRNAs in response to hypoxia using small RNA sequencing. A highly diverse population of abundant miRNA species was detected in the nucleus, of which the majority (56%) was found to be preferentially localized in one compartment or the other. Induction of hypoxia resulted in changes in miRNA levels in both nuclear and cytoplasmic compartments, with the majority of changes being restricted to one location and not the other. Notably, the classical hypoxamiR (miR-210-3p) was highly up-regulated in the nuclear compartment after hypoxic stimulus. These findings reveal a previously unappreciated level of molecular complexity in the physiological response occurring in ischemic tissue. Furthermore, widespread differential miRNA expression in the nucleus strongly suggests that these small RNAs are likely to perform extensive nuclear regulatory functions in the general case.


Conflict of interest statement

The authors declare no competing interests.

Figures

Figure 1
Figure 1
Isolation of nuclear and cytoplasmic fractions. (a) Western blot analysis of cytoplasmic (β-tubulin) and nuclear (histone H3) marker protein expression. (b) RT-qPCR analysis of nuclear-enriched lncRNAs (Malat1 and Neat1) or cytoplasm-enriched tRNAs (tRNA-Lys-TTT and tRNA-Met-CAT). Values are mean ± SEM, n = 3–4, *P < 0.05, **P < 0.01, ***P < 0.001 (t-test with Welch correction for unequal variance, comparisons are to the matched group-matched Cytoplasmic fraction).
Figure 2
Figure 2
Nuclear and cytoplasmic small RNAs. (a) Principal component analysis (PCA) shows tight clustering of biological replicates. Principal component one (PC1) shows the separation between nuclear and cytoplasmic samples (74% of variation), whereas PC2 depicts the response to hypoxic stress (12% of variation). (b) Hierarchical clustering of differential expression between nuclear and cytoplasmic samples (adjusted P < 0.01, fold change ≥ |2|). Scale bars show mean-centered log2 normalized counts (row Z-score) where red and blue indicate higher and lower than mean abundance respectively. (c) Volcano plot depicting nuclear and cytoplasmic miRNA enrichment. (d) MA plot analysis of location-enriched miRNAs showing that differentially nuclear/cytoplasm-enriched miRNAs were observed over a broad range of absolute expression values. (e) The two most location-enriched miRNAs across the dataset were miR-3535 (in the nucleus) and miR-27a-5p (in the cytoplasm). (f) miRNA-expression levels of nuclear (miR-3535) and cytoplasmic (miR-27a-5p) miRNAs identified by miRNA-seq were validated by RT-qPCR. miRNA levels were normalized to miR-186–5p and the mean value of the Nucleus 0 h group scaled to a value of one. Values are mean ± SEM, n = 2 (sRNA-seq), n = 3 (RT-qPCR), *P < 0.05, **P < 0.01, ***P < 0.001 (one-way ANOVA with Bonferroni post hoc test, comparisons are to the Cytoplasm 0 h group).
Figure 3
Figure 3
Differential expression of nuclear and cytoplasmic miRNAs upon hypoxic stimulus. (a) Comparison of expression ratios for nuclear and cytoplasmic libraries (0 h vs 24 h hypoxia). No significant correlation was observed between the nuclear and cytoplasmic expression ratios. (b) Heatmap of common differentially expressed miRNAs upon hypoxia in both nuclear and cytoplasmic samples. (c) Heatmap of the differentially expressed miRNAs in cytoplasmic fraction only. (d) Heatmap of the differentially expressed miRNAs in nuclear fraction only. Scale bars show mean-centered log2 normalized counts (row Z-score) where red and blue indicate higher and lower than mean abundance respectively. (e) miR-210-3p was identified to be highly up-regulated upon hypoxia in the nuclear fraction. (f) miR-210-3p expression in nuclear and cytoplasmic extracts was validated with RT-qPCR. miRNA-levels were normalized to miR-186-5p levels and the mean value of the Cytoplasm 0 h group scaled to a value of one. Values are mean ± SEM, n = 2 (sRNA-seq), n = 3 (RT-qPCR), *P < 0.05, **P < 0.01, ***P < 0.001 (one-way ANOVA and Bonferroni post hoc test, statistical comparisons are to the Cytoplasm 0 h group unless otherwise indicated).
Figure 4
Figure 4
miR-210-3p localization upon hypoxic stimulus. miR-210-3p localization in C166 cells in normoxia and hypoxia (24 h) using fluorescent in situ hybridization (FISH). miR-210-3p is found in nucleus in normoxia and hypoxia. DAPI was used to stain nuclei of the cells. miR-210-3p is stained in red. To better display the co-localization of nuclear and miR-210-3p staining, areas within green and red rectangles show the view to the confocal microscopy image stack from the side.
Figure 5
Figure 5
Analysis of putative miRNA sequence motifs affecting subcellular localization. (a) sRNA-seq normalized counts values for C166 nuclear and cytoplasmic fractions, with and without hypoxic stress, for the major arms of miR-29 family, and the minor arm of miR-29a-5p. (b) Alignments of all detected miR-29 miRNA family members, and miR-199a/b-5p. The positions of the 5ʹ-AGUGUU-3ʹ hexanucleotide motif are indicated in yellow. (c) Normalized sRNA-seq counts for miR-199a/b-5p. (d) Nuclear and cytoplasmic enrichment sequences identified by de novo motif enrichment. (e) Output statistics for de novo motif discovery; enrichment P-values, percentage of enriched miRNAs in containing each motif, and percentage of non-enriched miRNAs (i.e. background) containing each motif. (For ambiguous nucleotides; K = U or G, S = G or C, R = A or G, W = A or U, D = A, G, or U, and H = A, C, or U). (f) Heatmap of sRNA-seq data for let-7 family members. Scale bars show mean-centered log2 normalized counts (row Z-score) where red and blue indicate higher and lower than mean abundance respectively. Occurrences of each enrichment motif in each family member are indicated in the greyscale heatmap. All values are mean ± SEM, n = 2 (sRNA-seq).

References

    1. Filipowicz W, Jaskiewicz L, Kolb FA, Pillai RS. Post-transcriptional gene silencing by siRNAs and miRNAs. Curr. Opin. Struct. Biol. 2005;15:331–41. doi: 10.1016/j.sbi.2005.05.006. - DOI - PubMed
    1. Roberts TC. The MicroRNA Biology of the Mammalian Nucleus. Mol Ther Nucleic Acids. 2014;3:e188. doi: 10.1038/mtna.2014.40. - DOI - PMC - PubMed
    1. Leung AKL. The Whereabouts of microRNA Actions: Cytoplasm and Beyond. Trends Cell Biol. 2015;25:601–610. doi: 10.1016/j.tcb.2015.07.005. - DOI - PMC - PubMed
    1. Zhang X, et al. MicroRNA Directly Enhances Mitochondrial Translation during Muscle Differentiation. Cell. 2014;158:607–619. doi: 10.1016/j.cell.2014.05.047. - DOI - PMC - PubMed
    1. Roberts, T. C. & Wood, M. J. A. Non-Canonical MicroRNA Biogenesis and Function in Applied RNAi: From Fundamental Research to Therapeutic Applications (eds Arbuthnot, P. & Weinberg, M. S.) 19–42 (Caister Academic Press, 2014).

Publication types