Comparative Study
. 2019 Jul 17;9(1):10351.
doi: 10.1038/s41598-019-46649-z.

Comparative performances of machine learning methods for classifying Crohn Disease patients using genome-wide genotyping data

Collaborators, Affiliations
Comparative Study

Comparative performances of machine learning methods for classifying Crohn Disease patients using genome-wide genotyping data

Alberto Romagnoni et al. Sci Rep. .

Abstract

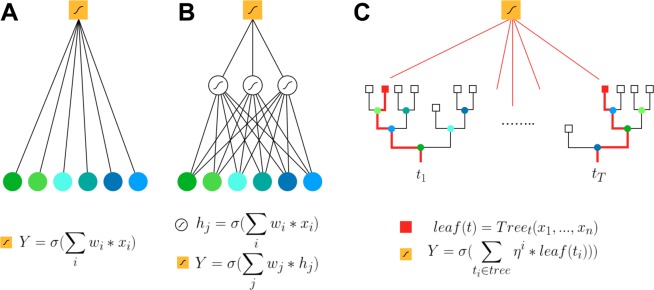
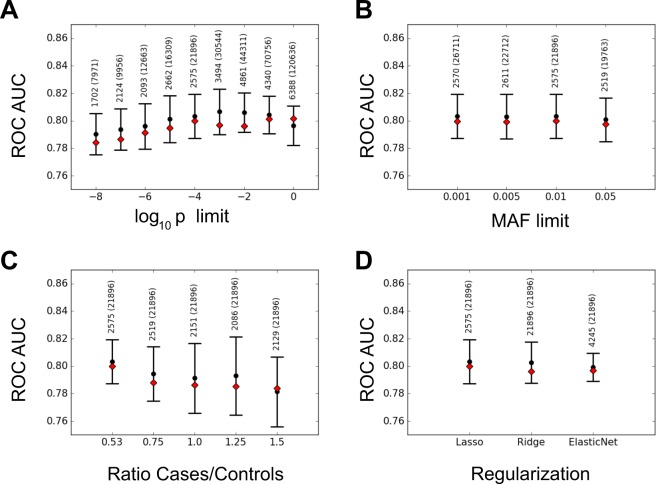
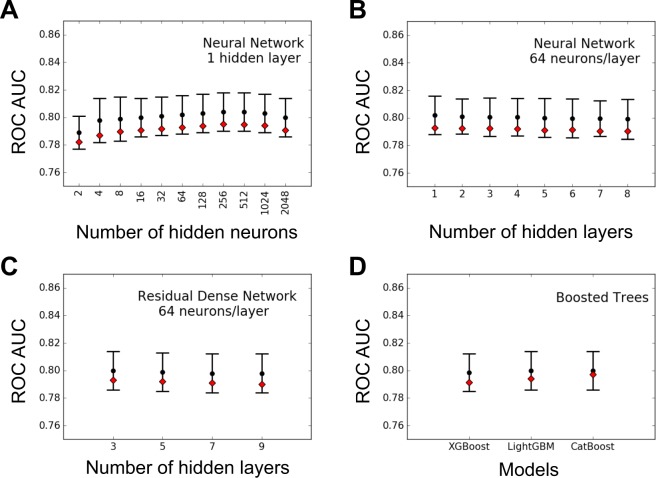
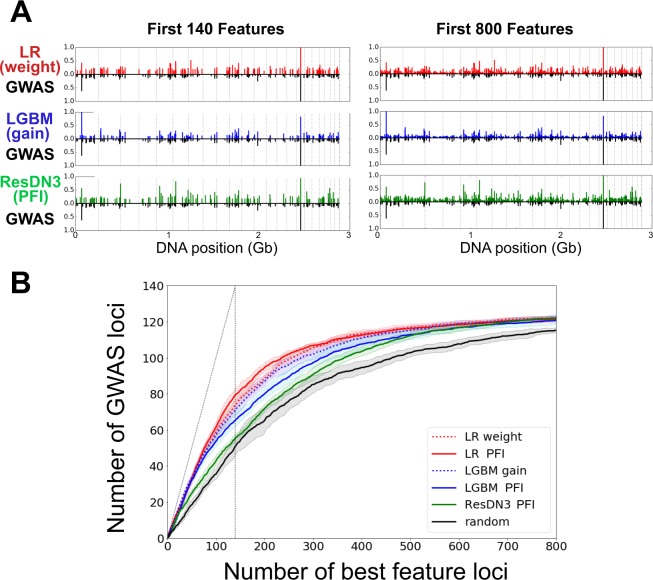
Crohn Disease (CD) is a complex genetic disorder for which more than 140 genes have been identified using genome wide association studies (GWAS). However, the genetic architecture of the trait remains largely unknown. The recent development of machine learning (ML) approaches incited us to apply them to classify healthy and diseased people according to their genomic information. The Immunochip dataset containing 18,227 CD patients and 34,050 healthy controls enrolled and genotyped by the international Inflammatory Bowel Disease genetic consortium (IIBDGC) has been re-analyzed using a set of ML methods: penalized logistic regression (LR), gradient boosted trees (GBT) and artificial neural networks (NN). The main score used to compare the methods was the Area Under the ROC Curve (AUC) statistics. The impact of quality control (QC), imputing and coding methods on LR results showed that QC methods and imputation of missing genotypes may artificially increase the scores. At the opposite, neither the patient/control ratio nor marker preselection or coding strategies significantly affected the results. LR methods, including Lasso, Ridge and ElasticNet provided similar results with a maximum AUC of 0.80. GBT methods like XGBoost, LightGBM and CatBoost, together with dense NN with one or more hidden layers, provided similar AUC values, suggesting limited epistatic effects in the genetic architecture of the trait. ML methods detected near all the genetic variants previously identified by GWAS among the best predictors plus additional predictors with lower effects. The robustness and complementarity of the different methods are also studied. Compared to LR, non-linear models such as GBT or NN may provide robust complementary approaches to identify and classify genetic markers.


Conflict of interest statement

The authors declare no competing interests.

Figures

Figure 1
Figure 1
Schematic representation of the machine learning models used in this paper for case/control classification. Colored circles represent input variables xi, yellow square the output prediction Y. Small wave symbol represents a sigmoidal function, used to transform a quantitative parameter into a probability of disease association. All formula are approximated and meant to give an idea of the models. (A) Logistic Regression: the prediction of this model is given by applying a sigmoid function to a weighted sum of the inputs. (B) Dense Neural Networks: they can be seen as multiple stacked logistic regressions. Here we represent a simplified network with one hidden layer with 3 neurons, and the output layer with 1 neuron. Each neuron receives the sigmoid of the weighted sum of its inputs. (C) Gradient Boosting on Decision Trees: the prediction is given by the sigmoid of the sum of the outputs leafs of hundreds of decision trees (η being the learning rate).
Figure 2
Figure 2
ROC AUC scores for Linear Regression model under different conditions on the dataset and on the penalty terms. Black dots and error bars refer to mean values and 2 standard deviation confidence intervals for 10 fold cross-validated models on the train dataset. Red diamonds refer to AUC scores obtained on the test dataset with the model trained on the entire train dataset, using the corresponding cross validated hyper-parameters. The numbers on top of the error bars refer to the number of features used by the model, and, in parenthesis, to the number of original features in the dataset. We show the AUC scores for: (A) different values of the upper bound on p-values for the SNP preselection phase, with MAF>0.01; (B) different values of the lower bound on MAF for the SNP preselection phase, with p-value p<104; (C) different values of the case/control ratio; (D) different types of regularization. In (C,D) p<104 and MAF>0.01.
Figure 3
Figure 3
ROC AUC scores for Non-Linear models. Black dots, error bars and red diamonds are as in Fig. 2, with preselected SNP at p<104 and MAF>0.01. We show the AUC scores for: (A) different numbers of neurons in the hidden layer of a dense NN with only one hidden layer; (B) different number of layers of 64 neurons, for a dense NN with multiple hidden layers; (C) different number of layers of 64 neurons, for a dense residual NN with pre-activation variant of residual block; (D) different gradient boosting for three kind of decision trees algorithms.
Figure 4
Figure 4
Comparison of the best features selected from different linear and non-linear models and those associated to CD in the GWAS meta-analysis by Jostins et al. Panel A shows the importance and the position on the genome of the best 140 (left) and 800 (right) SNPs, selected by logistic regression with Lasso regularization and weight criterion (LR weight), LightGBM with gain criterion (LGBM gain), a dense residual neural network with 3 hidden layers with permutation feature importance criterion (ResDN3 PFI), and of those reported by Jostins et al.(GWAS). The importance of the SNPs is given by the criteria discussed in the main text, while for GWAS we show the |log(OR)|. Dotted vertical lines indicate the separation between chromosomes. Panel B shows the number of common loci (as defined in the main text) between the different models with different criteria for feature selection and GWAS analysis, as a function of the first x selected best loci. The random model was built using randomly weighted SNPs. Solid and dotted lines represent the mean values over all the subsets, while shaded regions represent the 1 standard deviation confidence intervals. The vertical dotted line indicates the 140 limit for GWAS, while the diagonal shows the perfect agreement baseline.
Figure 5
Figure 5
Internal and between-models coherence in feature importance selection. We show the robustness R as a function of the first x best loci. In panel (A) we consider the robustness of a given model/criterion, when trained on two different subsets of the data. In panel (B) we show the robustness between the same model when two different criteria are considered on the same subset of the dataset. In panel (C) we compare two different models/criteria, on the same subset of the dataset. Finally in panel (D) we show the same analysis of panel (A) for combination of models. Solid and dotted lines represent the mean values of the robustness distributions, respectively in panels (A and D) over all the couples of subsets (10 subsets, for a total of 45 couples), and in panels (B,C) over all the subsets (10 subsets, for a total of 10 couples). Shaded regions represent the 1 standard deviation confidence intervals.

References

    1. Baumgart DC, Sandborn WJ. Crohn’s disease. The Lancet. 2012;380:1590–1605. doi: 10.1016/S0140-6736(12)60026-9. - DOI - PubMed
    1. Wray NR, Yang J, Goddard ME, Visscher PM. The genetic interpretation of area under the roc curve in genomic profiling. PLoS genetics. 2010;6:e1000864. doi: 10.1371/journal.pgen.1000864. - DOI - PMC - PubMed
    1. Jostins L, et al. Host–microbe interactions have shaped the genetic architecture of inflammatory bowel disease. Nature. 2012;491:119. doi: 10.1038/nature11582. - DOI - PMC - PubMed
    1. Liu JZ, et al. Association analyses identify 38 susceptibility loci for inflammatory bowel disease and highlight shared genetic risk across populations. Nature genetics. 2015;47:979. doi: 10.1038/ng.3359. - DOI - PMC - PubMed
    1. Momozawa Y, et al. Resequencing of positional candidates identifies low frequency il23r coding variants protecting against inflammatory bowel disease. Nature genetics. 2011;43:43. doi: 10.1038/ng.733. - DOI - PubMed

Publication types

LinkOut - more resources